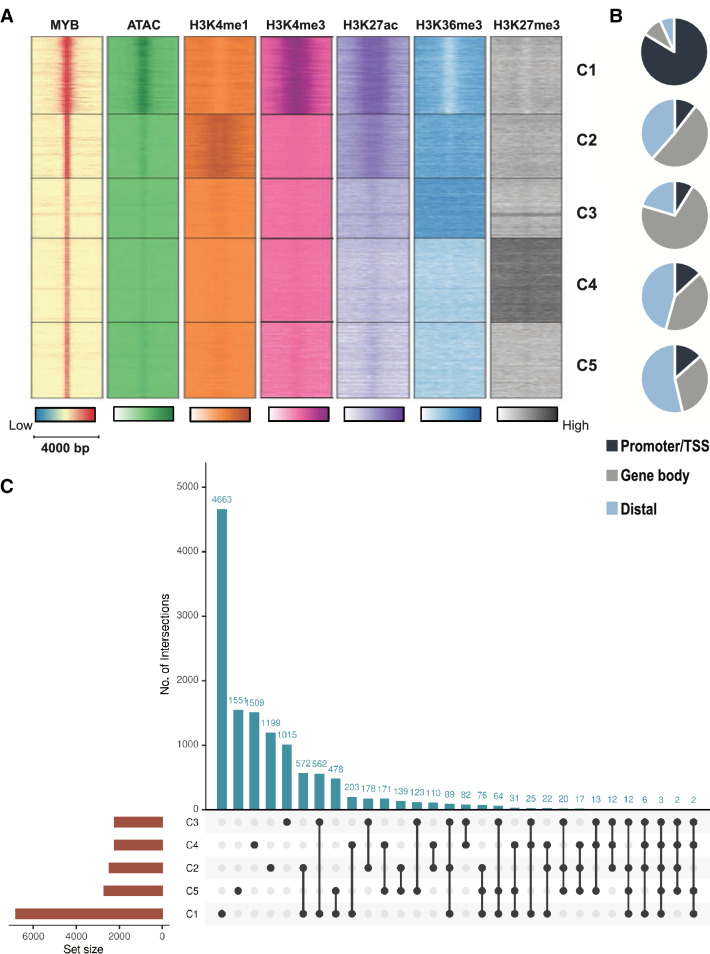
Figure 3.
Epigenome-wide clustering of MYB. (A) Heatmap displaying the current MYB ChIP-seq signal, public ChIP-seq signals for H3K4me1 (GSM733692), H3K4me3 (GSM733680), H3K27ac (GSM733656), H3K36me3 (GSM733714), and H3K27me3 (GSM733658) ChIP-seq, and ATAC-seq signal from our previous data (GEO accession: GSE92871) within a 4 kb window around the summit of MYB bound regions. We identified five clusters as indicated on the heatmaps, generated by ChAsE 1.1.246 (termed C1-C5 in the figure). (B) Distribution of MYB binding sites between TSS/promoter, gene body or distal regions in each cluster C1-C5. (C) An upset plot showing overlaps of the number of genes associated with each C-group. The upset plot was generated using the Intervene upset module v0.6.478.

