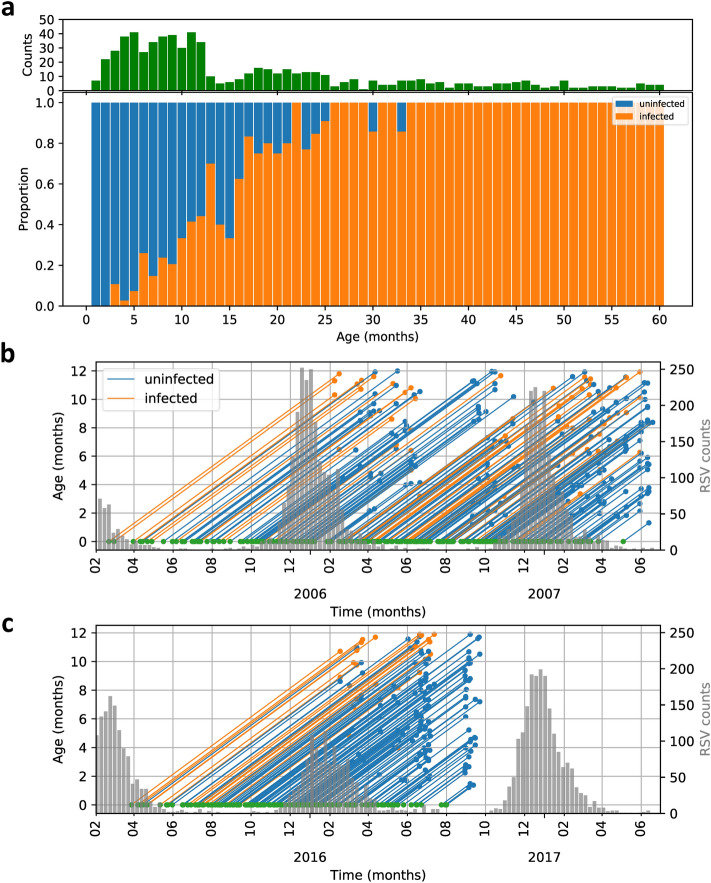
Figure 2.
Dependence of infection status on age and date of birth within the year. (A) Bar chart (top) and proportional bar chart (bottom) showing the total number of samples (green), and fractions that are classified as infected (orange) and uninfected (blue). (B,C) Lexis diagrams of infection status of infants under 12 months of age in the 2006/2007 and 2016/2017 cohorts (see Supplement Figure 3 for full age range). Left-hand y-axes correspond to individual life histories. Individuals are born at the green dots, and sampled at the orange (infected) and blue (uninfected) dots, respectively. Right-hand Y-axes correspond to the histograms of the weekly number of positive RSV tests in hospitals in the Netherlands, representing the RSV epidemics.

