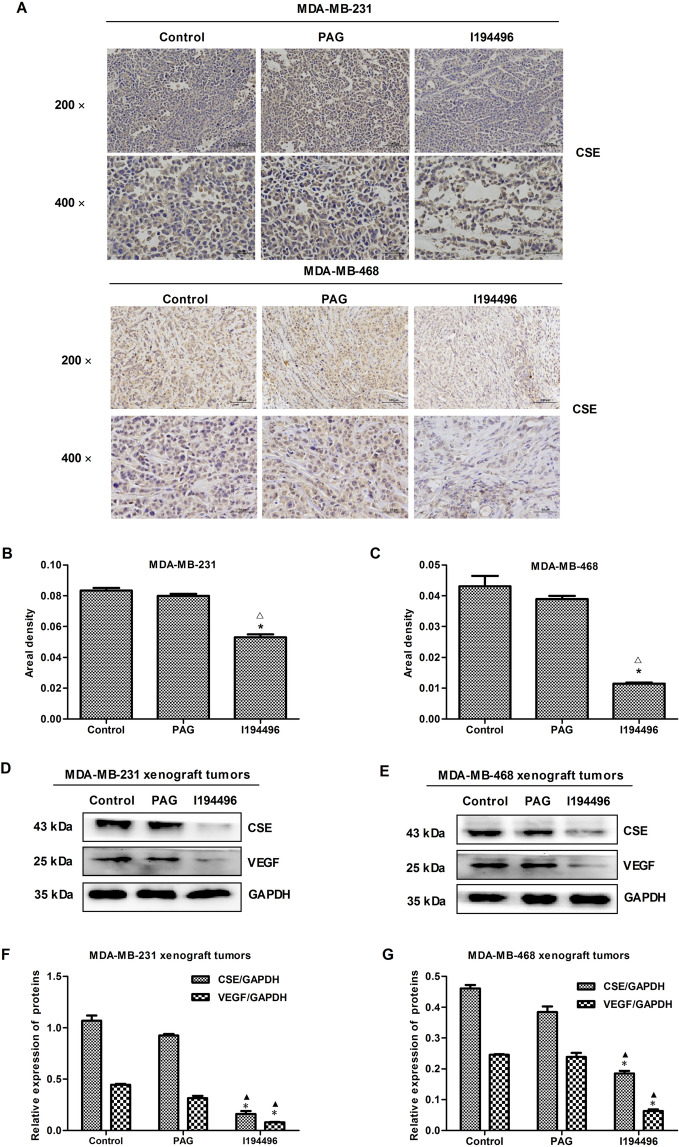
Figure 8.
IHC and western blot assays of MDA-MB-231 and MDA-MB-468 xenograft tumors in nude mice. (A) Representive photographs of CSE staining in MDA-MB-231 and MDA-MB-468 xenograft tumors; original magnification ×200 and ×400. (B, C) CSE-positive expression level was calculated as areal density = IOD/AREA, where IOD represents positive cumulative optical density values and AREA represents the pixel area of the organization. Values are presented as mean ± SEM (n = 5); *P < 0.05 compared with the control group; △P < 0.05 compared with PAG group. (D, E) CSE and VEGF expression analysis in MDA-MB-231 and MDA-MB-468 xenograft tumors. (F, G) The statistical analysis of CSE and VEGF expression level in MDA-MB-231 and MDA-MB-468 xenograft tumors; Values are presented as mean ± SEM (n = 5); *P < 0.05 compared with the control group; ▲P < 0.05 compared with PAG group.

