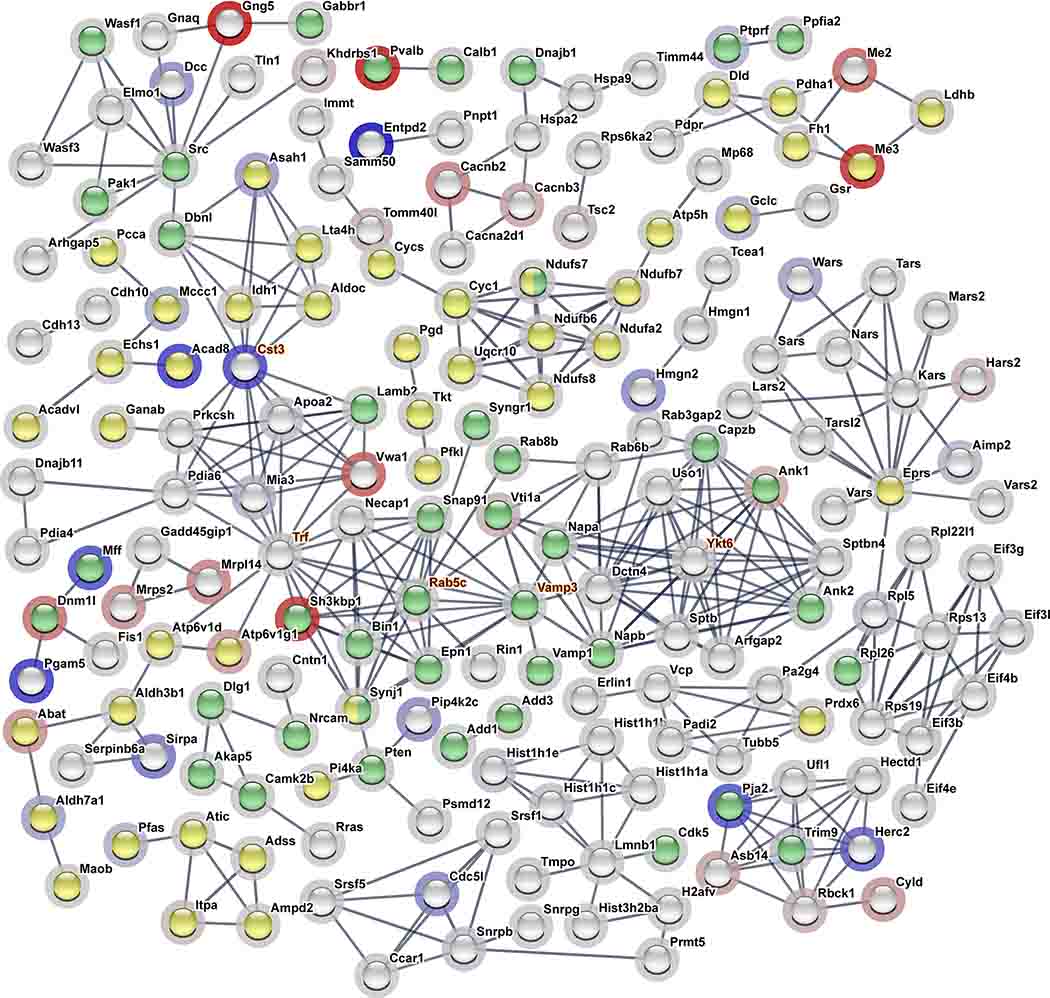
Figure 3. Differentially Expressed Protein Interaction Network.
The 390 differentially expressed proteins (p<0.05) were submitted to String-db. Only high confidence interactions >0.9 with at least 1 connected node are displayed. Node halo corresponds to the log2 AR HAP relative to LAP mice (red = increased expression and blue = decreased expression). Node color represents identified proteins associated with the significantly enriched metabolic pathways KEGG Pathway (yellow) and the Synapse Cellular Component (green). Hub proteins are highlighted in orange text (n = 8 per line)

