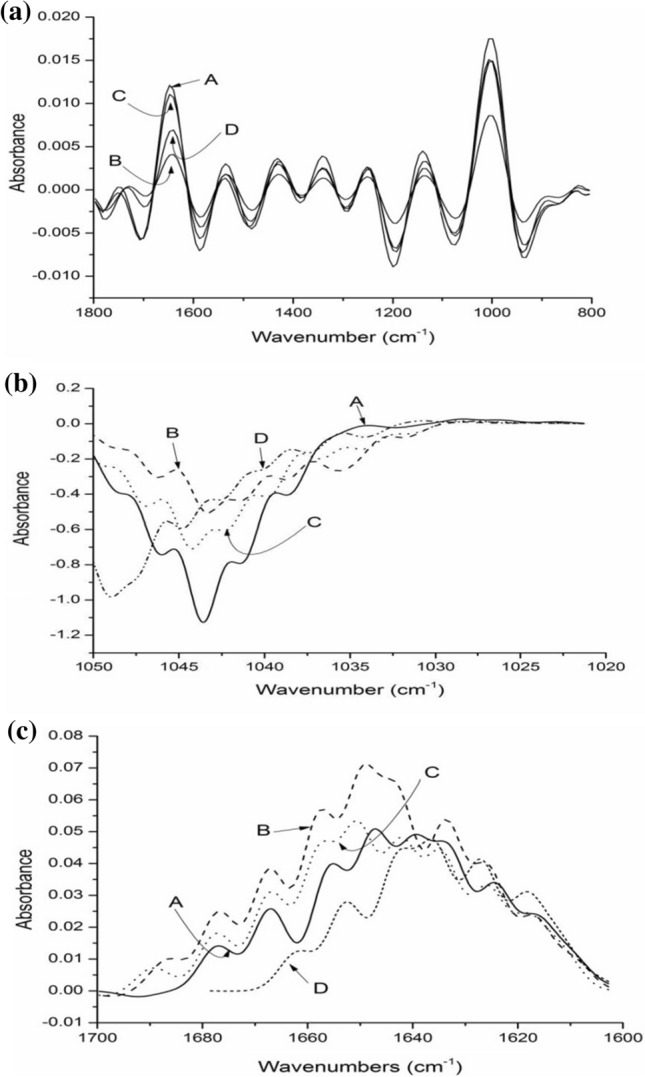
Fig. 3. a.

FTIR spectra of native cereal flours from wave numbers 800 to 1800 cm−1: (A) wheat flour, (B) barley flour, (C) sorghum flour (D) millet. b Deconvoluted spectra of native and germinated sorghum flours (A) sorghum flour (B) sorghum flour germinated for 24 h (C) sorghum flour germinated for 48 h (D) sorghum flour germinated for 72 h (c) Deconvoluted spectra of native and germinated millet flours (A) millet flour (B) millet flour germinated for 24 h (C) millet flour germinated for 48 h (D) millet flour germinated for 72 h
