
Fig. 4.
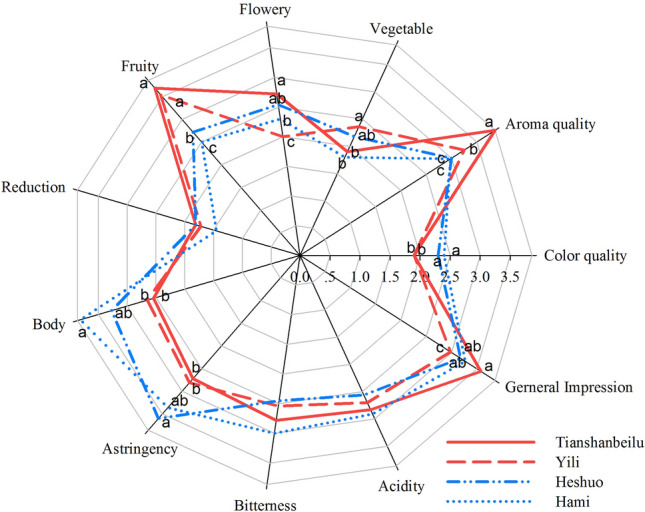
Sensory analysis radar plot of Cabernet Sauvignon wines from four winemaking areas in the Xinjiang region. Lines with red colour highlight the areas in northern Xinjiang, whereas lines with blue colour highlight the areas in southern Xinjiang. The benchmark for evaluation ranged from zero to five. Different letters show the results of ANOVA at p < 0.05