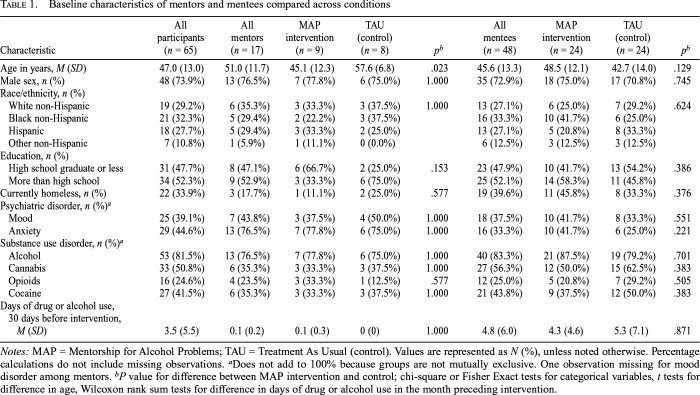
Table 1.
Baseline characteristics of mentors and mentees compared across conditions
| Characteristic | All participants (n = 65) | All mentor (n = 17) | MAP intervention (n = 9) | TAU (control) (n = 8) | pb | All mentees (n = 48) | MAP intervention (n = 24) | TAU (control) (n = 24) | pb |
| Age in years, M (SD) | 47.0 (13.0) | 51.0 (11.7) | 45.1 (12.3) | 57.6 (6.8) | .023 | 45.6 (13.3) | 48.5 (12.1) | 42.7 (14.0) | .129 |
| Male sex, n (%) | 48 (73.9%) | 13 (76.5%) | 7 (77.8%) | 6 (75.0%) | 1.000 | 35 (72.9%) | 18 (75.0%) | 17 (70.8%) | .745 |
| Race/ethnicity, n (%) | |||||||||
| White non-Hispanic | 19 (29.2%) | 6 (35.3%) | 3 (33.3%) | 3 (37.5%) | 1.000 | 13 (27.1%) | 6 (25.0%) | 7 (29.2%) | .624 |
| Black non-Hispanic | 21 (32.3%) | 5 (29.4%) | 2 (22.2%) | 3 (37.5%) | 16 (33.3%) | 10 (41.7%) | 6 (25.0%) | ||
| Hispanic | 18 (27.7%) | 5 (29.4%) | 3 (33.3%) | 2 (25.0%) | 13 (27.1%) | 5 (20.8%) | 8 (33.3%) | ||
| Other non-Hispanic | 7 (10.8%) | 1 (5.9%) | 1 (11.1%) | 0 (0.0%) | 6 (12.5%) | 3 (12.5%) | 3 (12.5%) | ||
| Education, n (%) | |||||||||
| High school graduate or less | 31 (47.7%) | 8 (47.1%) | 6 (66.7%) | 2 (25.0%) | .153 | 23 (47.9%) | 10 (41.7%) | 13 (54.2%) | .386 |
| More than high school | 34 (52.3%) | 9 (52.9%) | 3 (33.3%) | 6 (75.0%) | 25 (52.1%) | 14 (58.3%) | 11 (45.8%) | ||
| Currently homeless, n (%) | 22 (33.9%) | 3 (17.7%) | 1 (11.1%) | 2 (25.0%) | .577 | 19 (39.6%) | 11 (45.8%) | 8 (33.3%) | .376 |
| Psychiatric disorder, n (%)a | |||||||||
| Mood | 25 (39.1%) | 7 (43.8%) | 3 (37.5%) | 4 (50.0%) | 1.000 | 18 (37.5%) | 10 (41.7%) | 8 (33.3%) | .551 |
| Anxiety | 29 (44.6%) | 13 (76.5%) | 7 (77.8%) | 6 (75.0%) | 1.000 | 16 (33.3%) | 10 (41.7%) | 6 (25.0%) | .221 |
| Substance use disorder, n (%)a | |||||||||
| Alcohol | 53 (81.5%) | 13 (76.5%) | 7 (77.8%) | 6 (75.0%) | 1.000 | 40 (83.3%) | 21 (87.5%) | 19 (79.2%) | .701 |
| Cannabis | 33 (50.8%) | 6 (35.3%) | 3 (33.3%) | 3 (37.5%) | 1.000 | 27 (56.3%) | 12 (50.0%) | 15 (62.5%) | .383 |
| Opioids | 16 (24.6%) | 4 (23.5%) | 3 (33.3%) | 1 (12.5%) | .577 | 12 (25.0%) | 5 (20.8%) | 7 (29.2%) | .505 |
| Cocaine | 27 (41.5%) | 6 (35.3%) | 3 (33.3%) | 3 (37.5%) | 1.000 | 21 (43.8%) | 9 (37.5%) | 12 (50.0%) | .383 |
| Days of drug or alcohol use, 30 days before intervention, M (SD) | 3.5 (5.5) | 0.1 (0.2) | 0.1 (0.3) | 0 (0) | 1.000 | 4.8 (6.0) | 4.3 (4.6) | 5.3 (7.1) | .871 |
Notes: MAP = Mentorship for Alcohol Problems; TAU = Treatment As Usual (control). Values are represented as N (%), unless noted otherwise. Percentage calculations do not include missing observations.
Does not add to 100% because groups are not mutually exclusive. One observation missing for mood disorder among mentors.
P value for difference between MAP intervention and control; chi-square or Fisher Exact tests for categorical variables, t tests for difference in age, Wilcoxon rank sum tests for difference in days of drug or alcohol use in the month preceding intervention.

