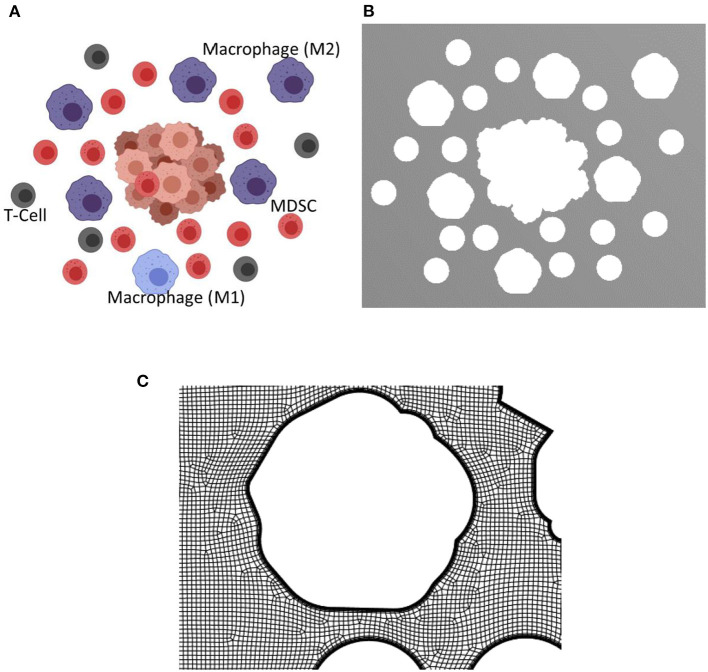
Figure 5.
Biorender image, computational domain, and a view of the mesh for the tumor microenvironment with macrophages, T cells, and MDSCs. The tumor microenvironments used for the simulations are created using Biorendor (48), and the rendered images is segmented to extract the geometry of various cell types in the computational domain. (A) Rendered image using Biorender. (B) Extracted computational domain using image processing techniques. (C) A zoomed in view of the mesh in TME used for the computational simulation.

