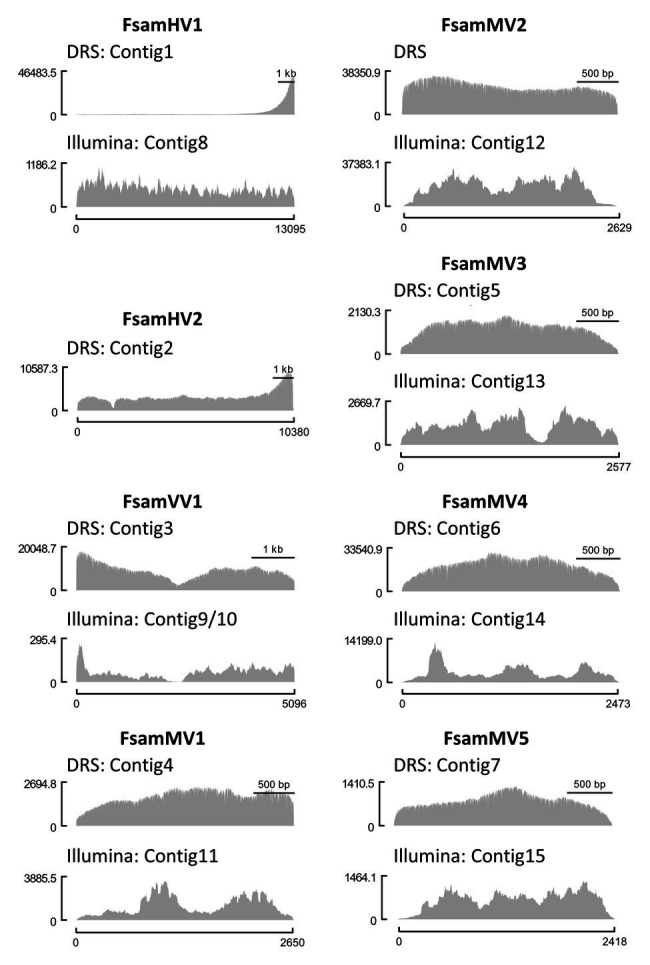
Figure 2.

Comparison of coverage uniformity between DRS and Illumina HiSeq. Genomic coverages of each viral contig from DRS (upper graph) and Illumina HiSeq (lower graph) visualized as histograms. The Illumina contigs of F. sambucinum hypovirus 1 (FsamHV1) and F. sambucinum mitoviruses (FsamMVs) and the DRS contig polished with Illumina reads of F. sambucinum victorivirus 1 (FsamVV1) were used as reference sequences for read mapping. The x-axis indicates the nucleotide position of a viral genome, and the y-axis indicates the coverage depth at each nucleotide position.
