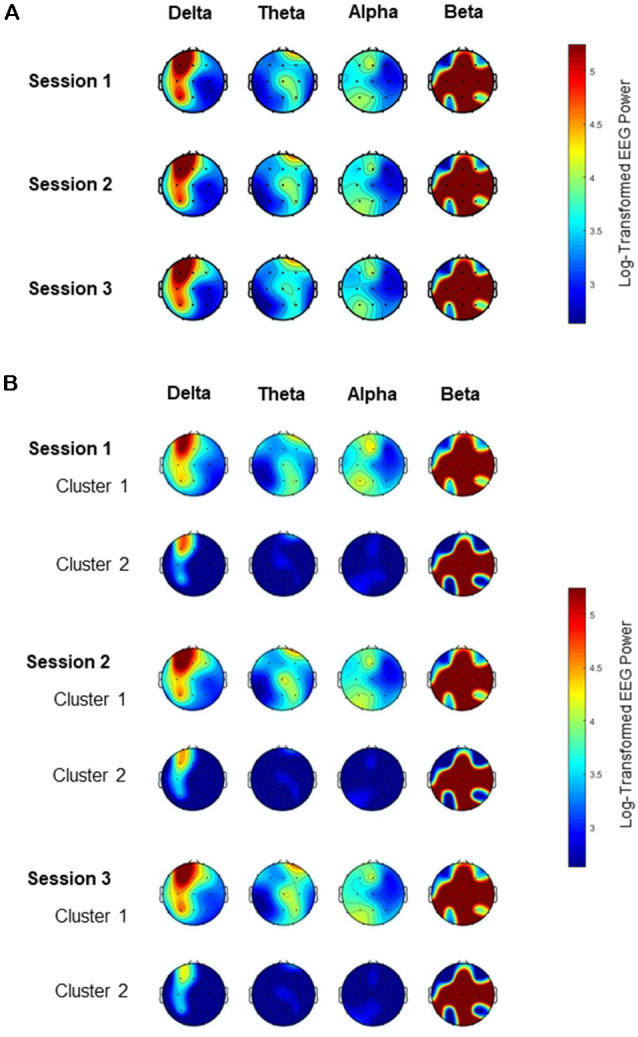
Figure 1.

Topography of electroencephalogram (EEG) power for the four frequency bands among the three EEG sessions. The color spectrum corresponds to the log-transformed EEG power for the delta (<4 Hz), theta (4–8 Hz), alpha (8–13 Hz) and beta (13–40 Hz) band. (A) EEG band powers are consistent across all three sessions. (B) EEG band powers are different between the two clusters in each of the three sessions, especially for the delta frequency band.
