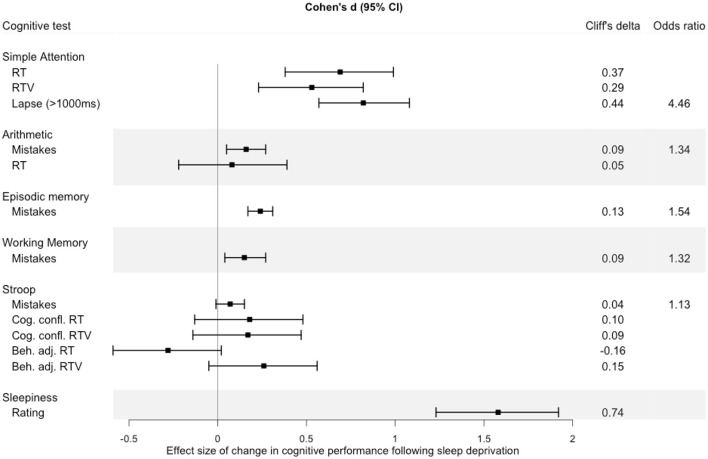
Figure 7.
Effect size of change in performance from baseline (22:30 h) to performance after sleep deprivation (mean of performance at 08:00 h, 12:30 h, 16:30 h). Error bars represent 95% confidence intervals around the Cohen’s d value. The effect size estimates were calculated using the compute.es (Del Re, 2013) package in R, and plotted using the forestplot (Max and Lumley, 2020) package.

