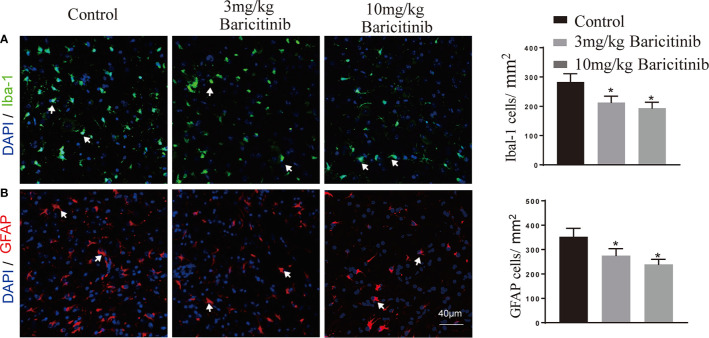
Figure 4.
Representative images and distribution of microglia (Iba-1) and astrocytes (GFAP) in spinal cord of EAE mice. (A) Significantly lower Iba-1 positive cells (microglia) count was recorded in the baricitinib-treated groups when compared with the control group. (B) Representative immunostained images showing the distribution of astrocytes. GFAP positive cells (astrocytes) decreased significantly in the baricitinib-treated groups when compared with the control group. 5 sections per animal. Quantitative data are the mean ± SEM. *p < 0.05; n = 6 per group.

