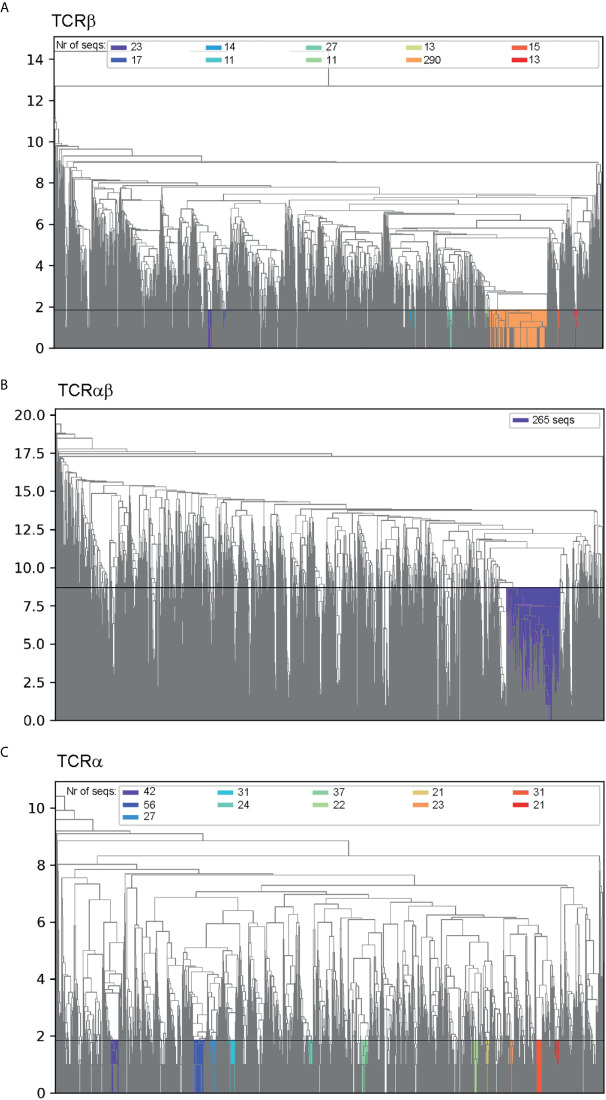
Figure 2.
Hierarchical clustering of (A) CDR3β sequences, (B) paired CDR3α:CDR3β sequences and (C) CDR3α sequences. The y-axis indicates the Levenshtein distance and the horizontal line shows distance that was used to cut the dendogram tree to generate the clusters. The clusters are colored and the respective number of sequences in each cluster are indicated in the legend.

