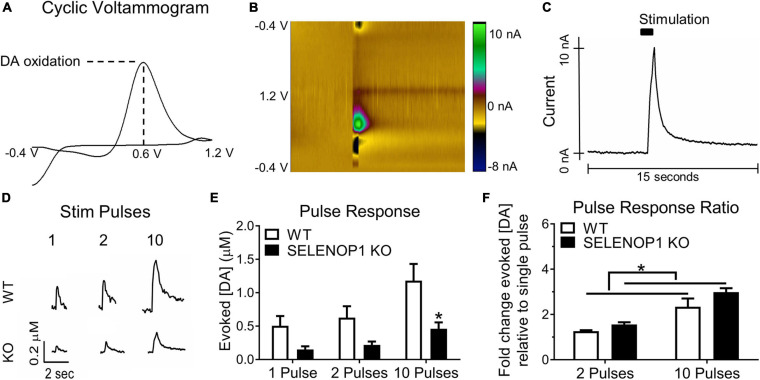
FIGURE 1.
Deletion of SELENOP1 resulted in reduced evoked DA responses measured in NAc brain slices. (A) sample cyclic voltammogram using 10-pulse stimulation showing peak oxidation potential around 0.6 V and used to confirm DA detection. (B) 3-dimensional heat map depicting the measured current according to color scale (right) for each point in voltage sweep (y-axis), plotted over time (x-axis). (C) sample evoked DA signal derived from the peak current of the plot in (B), following stimulation at 5 s. (D) representative traces from C57 WT mice and C57 SELENOP1 KO mice, aged 3–5 months, in response to 1-, 2-, and 10-pulse stimulation. (E) mean (± SEM) peak DA responses from 1-, 2, and 10-pulse stimulation. Two-way ANOVA revealed a significant effect of genotype on the amount of DA released (F(1,24) = 17.38; p = 0.0003). A 1-pulse stimulation caused DA release from slices of WT mice (0.5 ± 0.15 μM; n = 5) and slices from SELENOP1 KO mice (0.15 ± 0.05 μM; n = 5), 2-pulse stimulation-induced DA release (0.63 ± 0.17 μM, n = 5 from WT mice compared to 0.22 ± 0.05 μM, n = 5 for SELENOP1 KO mice). A 10-pulse stimulation induced greater DA release in WT (1.2 ± 0.37 μM; n = 5) than in SELENOP1 KO mice (0.46 ± 0.12 μM; n = 5; *p = 0.0198, Tukey’s multiple comparisons test). (F) mean (± SEM) ratios of either 2-pulse-elicited responses or 10-pulse-elicited responses to 1-pulse-elicited responses. Two-way ANOVA revealed a significant effect of genotype (F(1,16) = 4.962; *p = 0.0406). The ratio of 2-pulse to 1-pulse responses in SELENOP1 KO mice was 1.6 ± 0.1 μM; n = 5, and in WT mice it was 1.26 ± 0.04 μM; n = 5. The ratio of 10-pulse to 1-pulse responses was comparable between SELENOP1 KO and WT mice (2.9 ± 0.3 μM; n = 5 and 2.3 ± 0.1 μM; n = 5, respectively). All values reported are mean ± SEM.

