FIGURE 4.
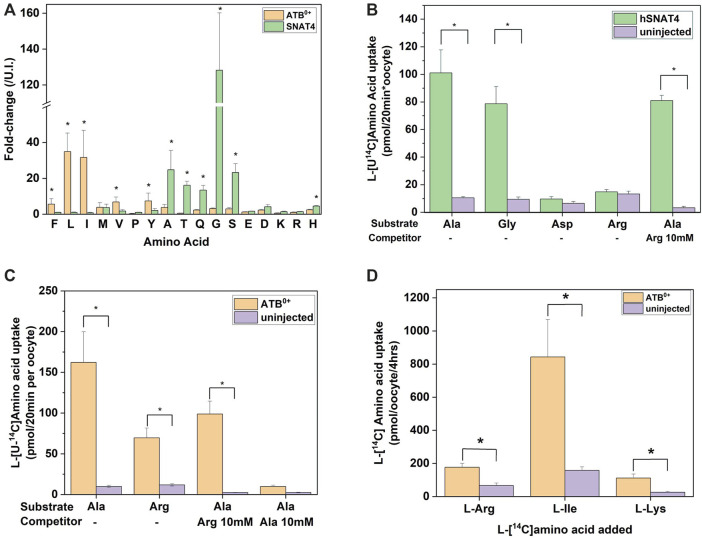
Analysis of SNAT4 and ATB0+ transport activity. Oocytes were injected with 10 ng of cRNA for SNAT4 and ATB0+ or remained un-injected (controls) for a 4-day expression period in OR2+ (pH 7.8). (A) Oocytes were incubated for 4 h in modified L-15 medium before sample extraction and analysis by LC-MS relative to un-injected oocytes (U.I.). (B) Transport of [14C]amino acids was measured over a time period of 20 min in SNAT4 expressing oocytes compared to non-injected oocytes. (C) Transport of [14C]alanine and arginine was measured over a time period of 20 min in ATB0+ expressing oocytes and compared to non-injected oocytes. Where indicated, alanine uptake was challenged by addition of 10 mM unlabelled arginine or alanine. (D) Transport of [14C]arginine, isoleucine and lysine was measured over a time period of 20 min in ATB0+ expressing oocytes and compared to non-injected oocytes. * Indicates a difference in the means between samples at the p < 0.05 level using a paired t-test as calculated from the absolute mass spectrometer raw values. The figures are a representative example of 3 experiments with n = 10 oocytes per repeat.

