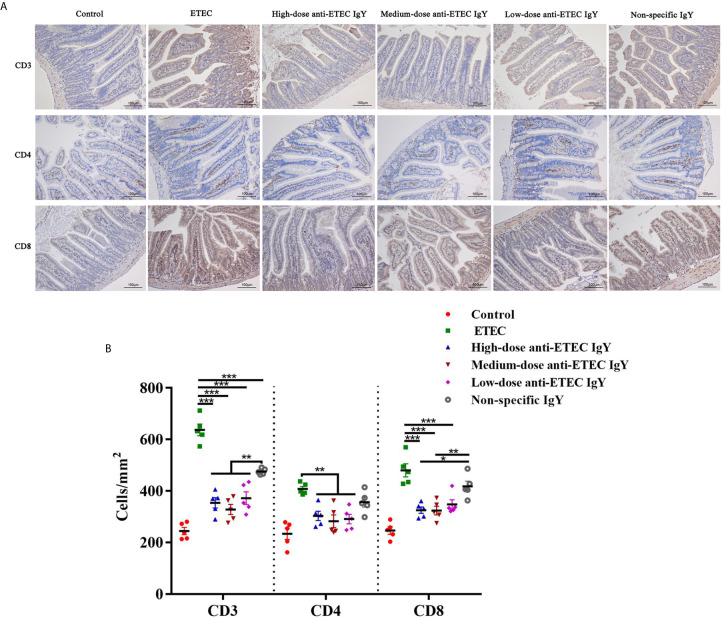
Figure 9.
(A) Representative images of the immunohistochemical localization of lymphocytes in the jejunum of control (neither IgY nor ETEC infection) mice, ETEC-infected mice, ETEC-infected mice treated with high-, medium- or low-doses anti-ETEC IgY or ETEC-infected mice treated with non-specific IgY. The lymphocyte markers and nuclei are stained brown and blue, respectively. (B) Quantification of lymphocyte populations in the jejunum of mice in different groups. Values are least squares means ± SEM, n=5. *P < 0.05, **P < 0.01, ***P < 0.001.

