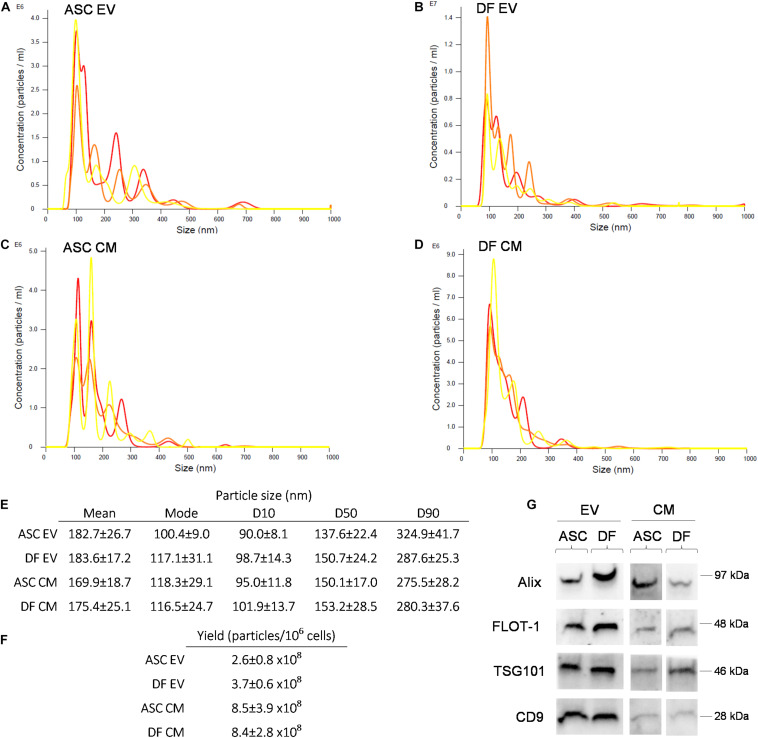
FIGURE 1.
(A–D) Representative NTA of EV and CM samples derived from ASCs and DFs. Each graph shows the size distribution of 3 consecutive 1 min runs for each sample. (E–F) Size distribution and vesicular yield deriving from 6 NTA measurements/group shown as mean ± SD. (G) Western Blot of CM and EV samples from ASCs and DFs, showing the expression of the vesicular markers Alix, FLOT-1, TSG101 and CD9. In each lane, 10μg of CM or EV deriving from 1.5 × 10⁶ cells were loaded.

