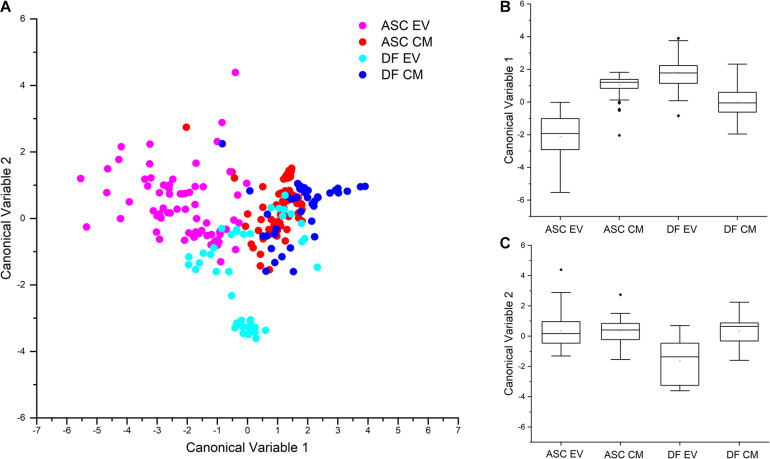
FIGURE 3.
(A) Scatterplot reporting the results of the PCA-LDA multivariate statistical analysis of ASC- and DF-derived secretome products, EVs and CM. Each dot represents one spectrum that has been assigned with canonical variable 1 and canonical variable 2 scores. As reported in the legend, different colors are assigned to spectra based on the source: ASC-derived EVs, pink; ASC-derived CM, red; DF-derived EVs, light blue; DF-derived CM, blue. Partial overlap of blue and red dots shows similarities in the spectra from ASC- and DF-derived CM. B, C: Box plots representing the canonical variable 1 (B) and canonical variable 2 (C) scores obtained after PCA-LDA analysis and the respective results of the non-parametric Kruskal-Wallis test for the analysis of variance. The statistical data demonstrate that CM and EV preparations can be distinguished by the PCA-LDA classification model.

