FIGURE 4.
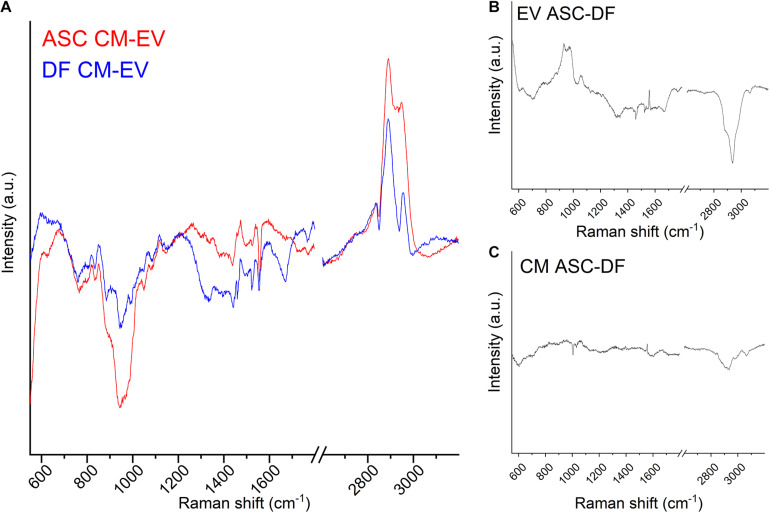
(A) Subtraction spectra obtained for ASC (red line) and DF (blue line) preparations by subtracting the EV average spectrum to the CM average spectrum. (B,C) Subtraction spectra obtained for CM (B) and EV (C) preparations by subtracting the ASC average spectrum to the DF average spectrum. All graphs display the same scale for the y-axis (Intensity of the Raman signal).

