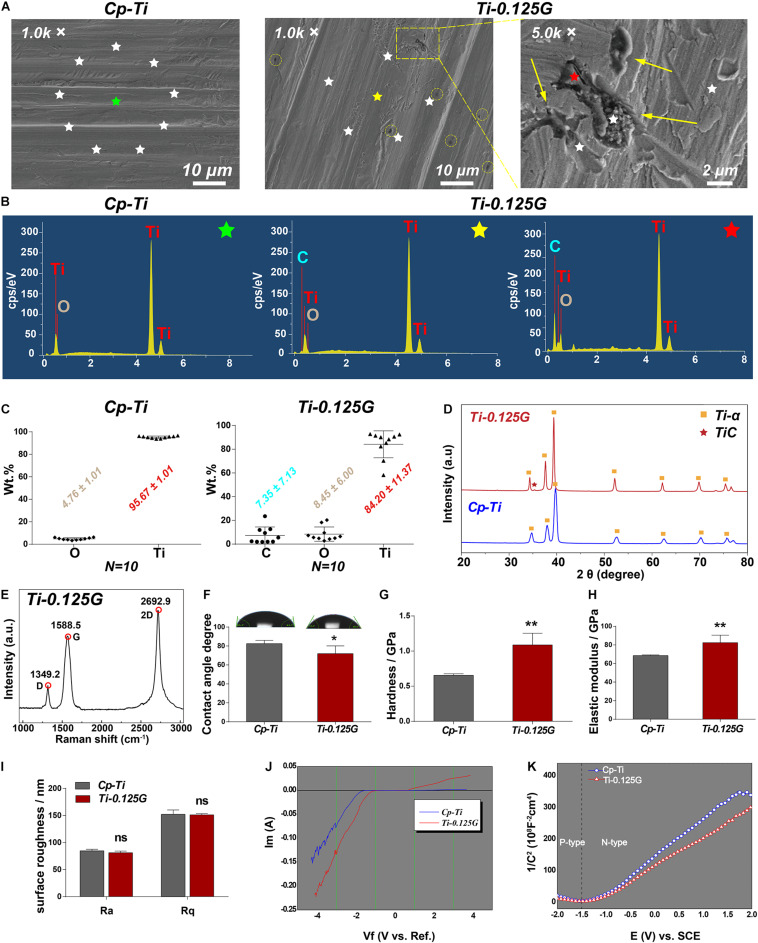
FIGURE 1.
Characterization of the sample. (A) SEM micrographs of the samples at different magnification. For the group of Ti-0.125G, the colored circles indicated the distribution of graphene aggregates at 1.0 K × magnification (scale bar = 10 μm), and the arrows marked the agglomerated graphene at 5.0 K × magnification (scale bar = 2 μm). (B) The respective EDS points’ spectra of Cp-Ti (green-starred) and Ti-0.125G (the point outside the Gr-like aggregate marked as a yellow star and the point inside the Gr-like aggregate marked as a red star). (C) The elemental concentrations of C, Ti, and O were measured by EDS semi-quantitative technique (expressed as average ± standard deviation; N = 10). (D) XRD patterns of Cp-Ti and Ti-0.125G (2θ = 20–80°). (E) Raman spectra of Ti-0.125G. (F) Wettability analysis (*p < 0.05). (G,H) Elastic modulus and nano-hardness analyses (**p < 0.01). (I) Surface roughness. No significant differences in Ra and Rq values. (J) The current-voltage (I-V) characteristics. (K) The conductivity type was depicted by the Mott-Schottky curves.

