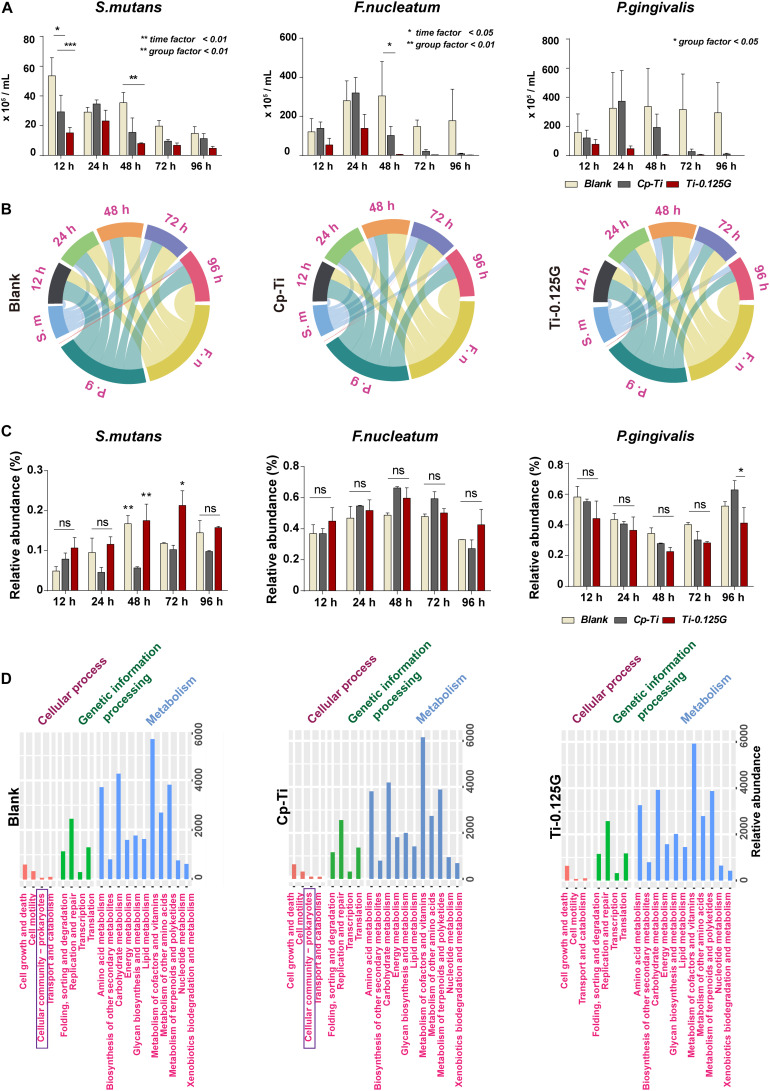
FIGURE 3.
Quantitative and proportional analyses of bacterial multispecies. (A) AQ-PCR detected the numbers of pathogens within the multispecies biofilm at 12–96 h of incubation. Dynamic changes in the proportional bacterial biomass in all groups presented in (B) a chord diagram and (C) a histogram quantitatively. (D) PICRUSt2 predictions of microbial functions based on the KEGG database. *p < 0.05, **p < 0.01.

