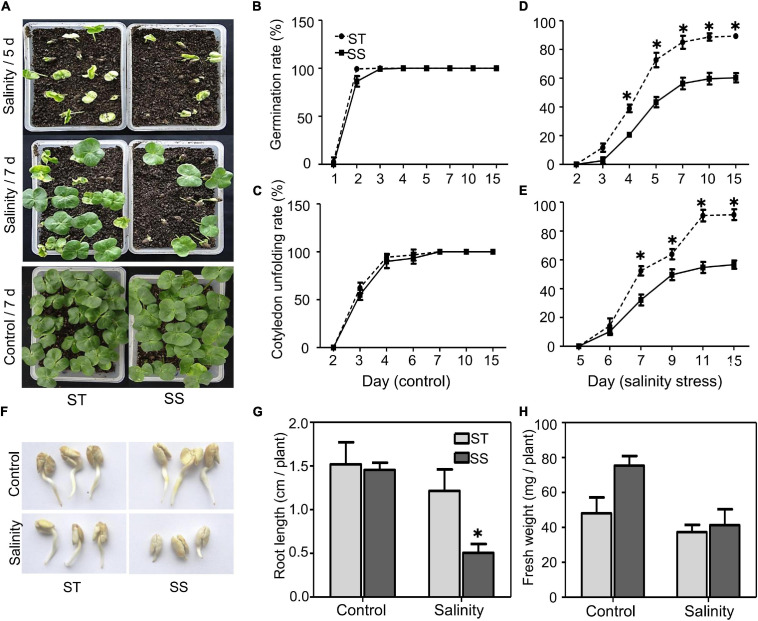
FIGURE 1.
Analysis of salinity tolerance during germination and post-germination. (A) Seed germination under control (water) or salinity stress (100 mM NaCl) conditions were analyzed at the indicated time. (B–E) Seed germination (%) and cotyledon unfolding rate (%) were analyzed. Germinated seeds were those that visibly emerged from soil. (F) Growth of primary roots under control (water) or salinity stress (100 mM NaCl) were photographed after 2 days treatment. (G) Root length and (H) fresh weight under control or salinity stress conditions (100 mM NaCl) were measured after 2 days treatment. The data are means ± SD from 25 seeds. The asterisk (*) indicate significant differences at P < 0.05 (t-test). All experiments were performed in triplicate.

