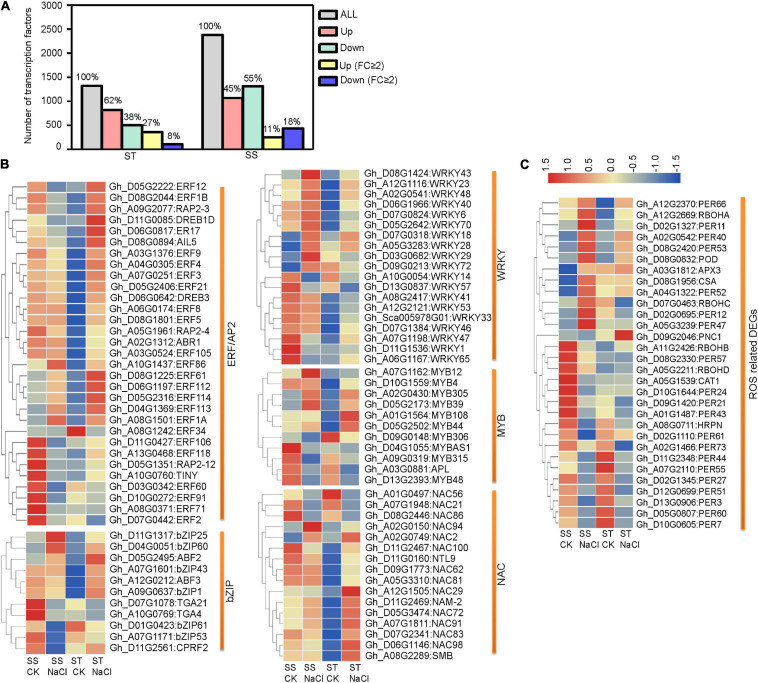
FIGURE 5.
Differentially expressed transcription factor- (TF) and reactive oxygen species- (ROS) related genes in ST and SS were analyzed. (A) Histograms show all TF genes and DEGs with a 2-fold or greater change in expression. (B) Heatmaps show FPKM values of five TF DEGs and (C) ROS-related DEGs in ST and SS. The FPKM values are represented with a color gradient from low (blue) to high (red).

