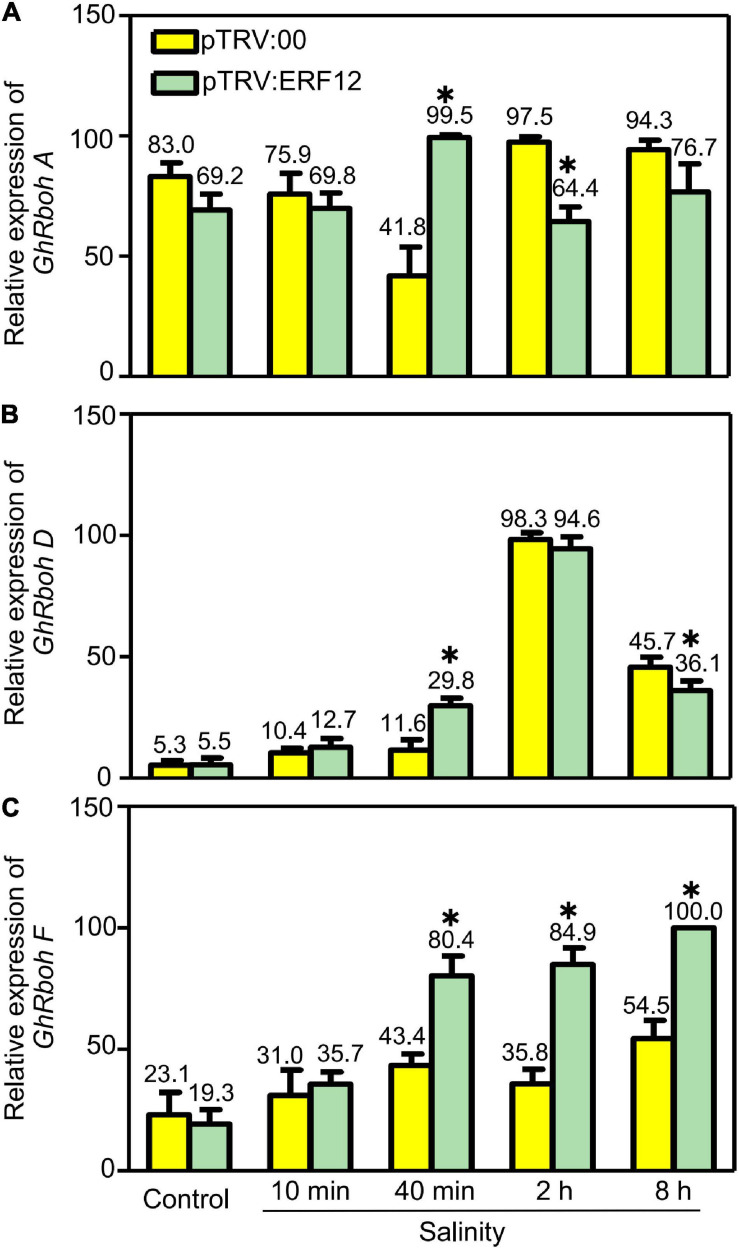
FIGURE 7.
Relative abundance of GhRboh genes (GhRboh A, D, and F) in GhERF12-silenced (TRV:ERF12) and control (TRV:00) plants were determined with qRT-PCR at the given time points. GhActin9 was used as an internal control. Data represent means ± SD (n = 6) from three independent replicates. The asterisk (*) indicate significant differences at P < 0.05 (t-test).

