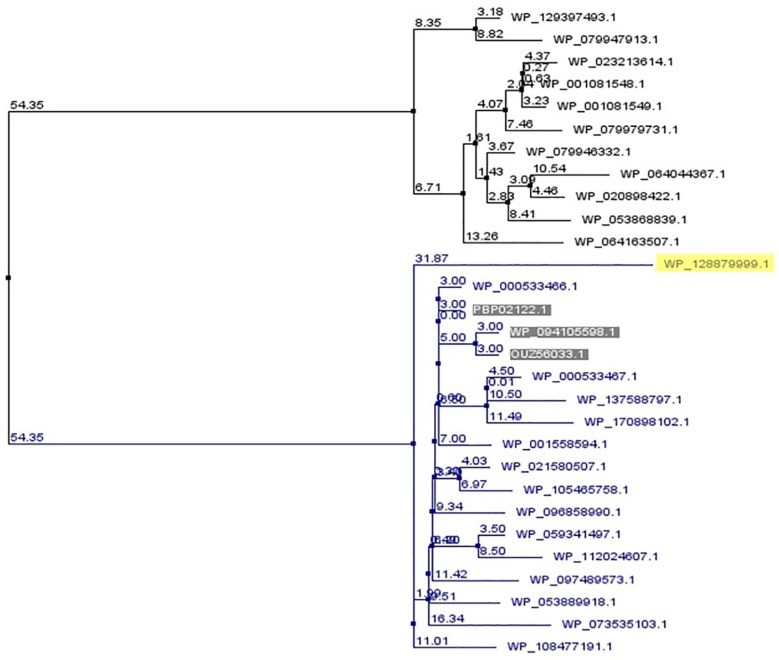
Figure 3.
A phylogenetic tree showing evolutionary relationship of the target protein (yellow marked) with other Tae4 proteins. The tree was generated using neighbor joining method based on BLOSUM62 scoring matrix by Jalview software. The values indicate percentage mismatches between 2 nodes (branch length). The target protein along with 3 other Shigella Tae4 amidases (shaded) seems to share the most recent common ancestor with E. coli amidases (blue color) rather than Salmonella enterica amidases (black color).

