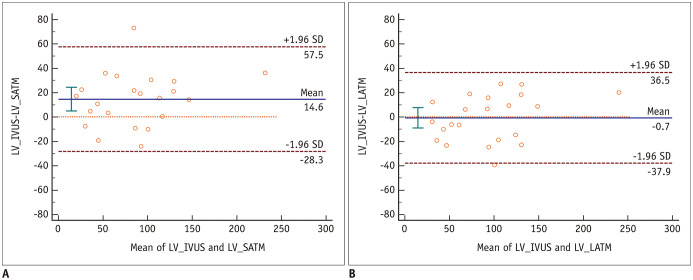
Fig. 1. Bland-Altman plots showing the differences between the CCTA-derived and IVUS LVs.
A. Bland-Altman plot of the difference between the LVs measured by IVUS and SATM (mean difference = 14.6 mm3; 95% CI of mean difference, 4.9 to 24.3 mm3). B. Bland-Altman plot of the difference between the LVs measured by IVUS and LATM (mean difference = −0.7 mm3; 95% CI of mean difference, −9.1 to 7.7 mm3). CCTA = coronary computed tomographic angiography, CI = confidence interval, IVUS = intravascular ultrasonography, LATM = location-adaptive threshold method, LV = lumen volume, SATM = scan-adaptive threshold method, SD = standard deviation

