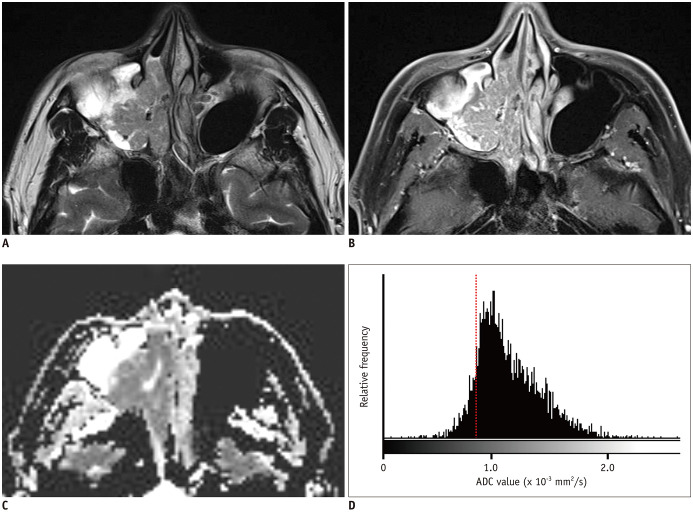
Fig. 4. A 54-year-old male patient with IP-SCC.
A. T2WI shows a soft tissue mass with a papillary growth pattern in the right maxillary sinus and nasal cavity. B. The mass shows partial loss of CCP and heterogeneous enhancement on fat-suppressed contrast-enhanced T1WI. C. On the ADC map, the mass shows homogeneous diffusion restriction. D. Histogram analysis revealed left-side peakedness and low 20th percentile cutoff of ADC values (0.86 × 10⁻³ mm2/s, dash line). T1WI = T1-weighted image, T2WI = T2-weighted image

