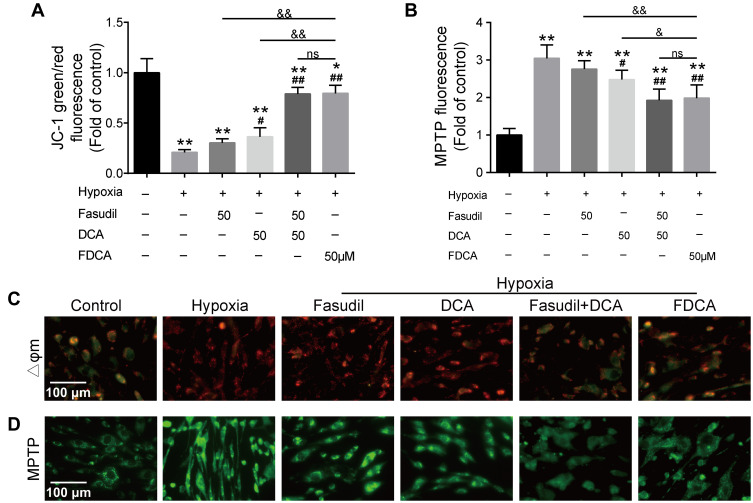
Figure 5.
FDCA alleviated hypoxia-induced mitochondrial dysfunction in human PASMCs. (A) Quantitative analysis of JC-1 green/red fluorescence intensity. (B) Quantitative analysis of mitochondrial permeability transition pore (MPTP) assay fluorescence intensity. (C) Representative images of mitochondrial membrane potential (Δψm). Red fluorescence indicates normal mitochondria and green fluorescence indicates depolarized mitochondria. (D) Representative images of MPTP opening. Stronger green fluorescence intensity indicates reduced MPTP opening. Data are expressed as mean ± SD (n=3-4). *P<0.05, **P<0.01 vs normoxia control group; #P<0.05, ##P<0.01 vs hypoxia group; &P<0.05, &&P<0.01 vs hypoxia+FDCA group, ns (not significant).

