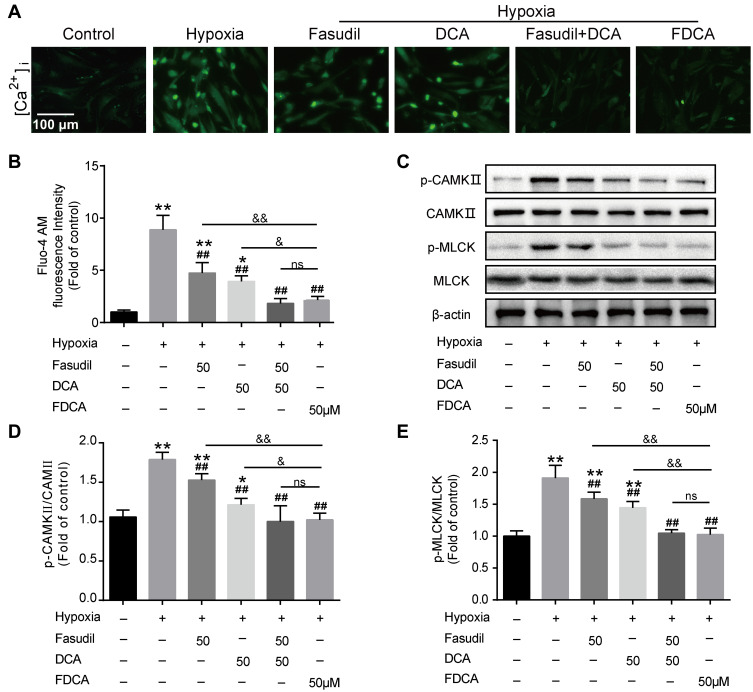
Figure 6.
FDCA inhibited hypoxia-induced activation of the intracellular Ca2+ signaling pathway. (A) Representative images of [Ca2+]i. (B) Quantitative analysis of Fluo-4 AM fluorescence intensity. (C) Representative Western blot bands. (D) Quantitative analysis of CaMK II/p-CaMK II. (E) Quantitative analysis of p-MLCK/MLCK. Data are expressed as mean ± SD (n=3-5). *P<0.05, **P<0.01 vs normoxia control group; ##P<0.01 vs hypoxia group; &P<0.05, &&P<0.01 vs hypoxia+FDCA group, ns (not significant).

