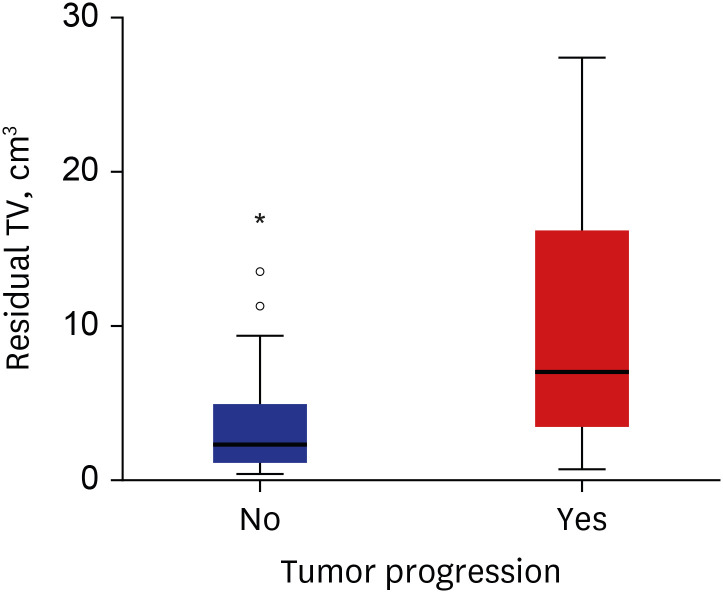
Fig. 3. Box and whisker plots of residual TV distribution according to tumor progression The boxes indicate the 25th and 75th percentiles. The whiskers indicate the minimum and maximum values, dots indicate the outliers, asterisk indicates extreme values, and thick horizontal lines indicate the median value.
TV = tumor volume.

