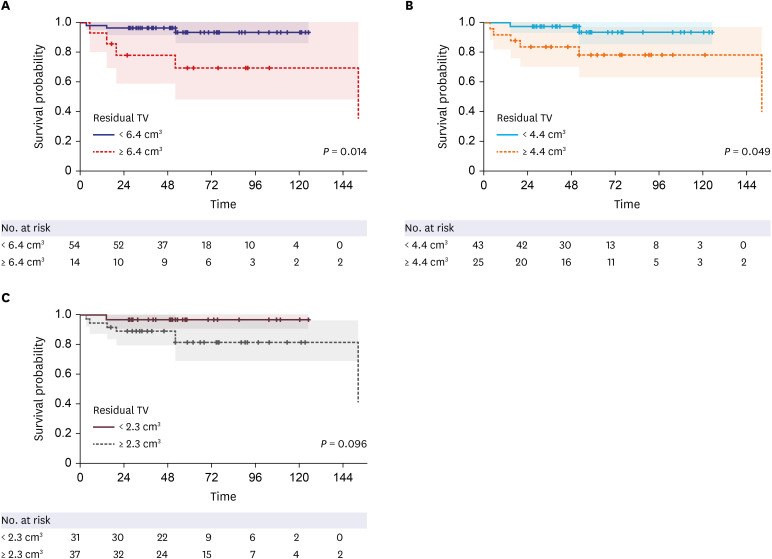
Fig. 5. Kaplan-Meier plot of PFS according to residual TV cut-offs. (A) The 5-year PFS rates in the group with residual TVs < 6.4 cm3 (54 patients) and that with residual TVs ≥ 6.4 cm3 (14 patients) were 93.3% and 69.3%, respectively (P = 0.014). (B) The 5-year PFS rates in the group with residual TVs < 4.4 cm3 (43 patients) and that with residual TVs ≥ 4.4 cm3 (25 patients) were 93.8% and 78.6%, respectively (P = 0.049). (C) The 5-year PFS rates in the group with residual TVs < 2.3 cm3 (31 patients) and that with residual TVs ≥ 2.3 cm3 (37 patients) were 96.8% and 81.7%, respectively (P = 0.096).
PFS = progression-free survival, TV = tumor volume.

