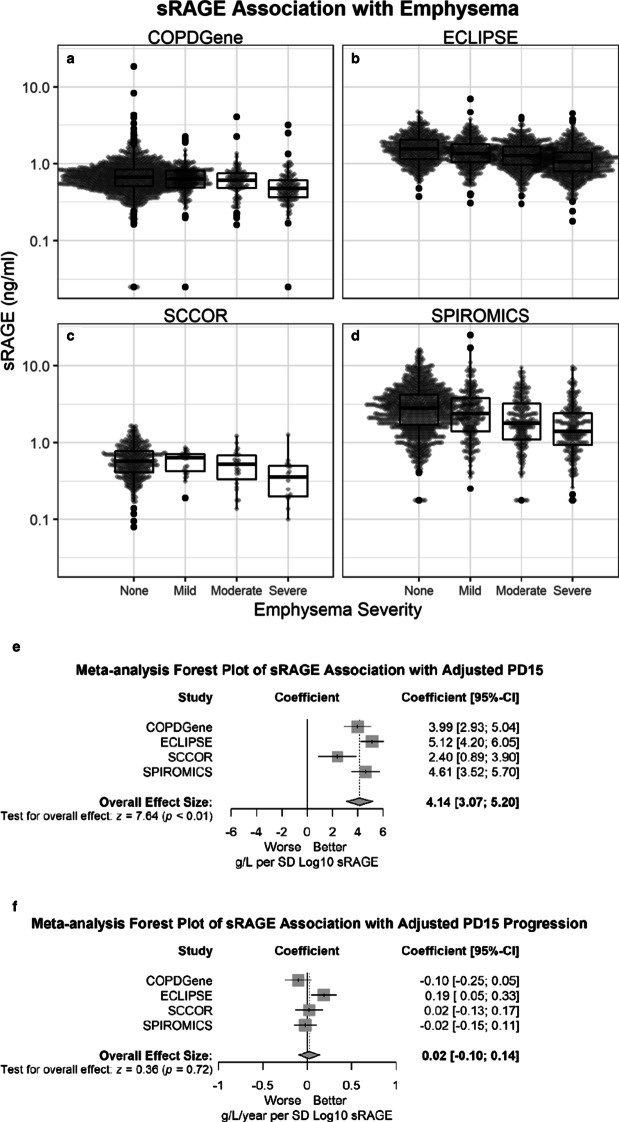
Fig. 3.
Severe emphysema is associated with lower sRAGE. sRAGE is shown on a log-scale y-axis. Each dot represents one subject. Overall p-value < 0.001 for all cohorts [COPDGene (n = 1372) (a), ECLIPSE (n = 1849) (b), SCCOR (n = 399) (c), and SPIROMICS (n = 1477) (d)]. Emphysema severity was defined as (LAA ≤ 5%), mild (LAA > 5 and ≤ 10%), moderate (LAA > 10 and ≤ 20%), or severe (LAA > 20%). Median, 25th percentile, 75th percentile, and whiskers (the minimum of 1.5 times IQR or highest/lowest value) are shown in the box plots. e Forest plot of sRAGE effect size estimates for baseline PD15adj for each cohort (squares) as well as a weighted estimate of the meta-analysis (diamond). The shaded represents the interquartile range and the whiskers represent the 95% confidence interval. f Forest plot of sRAGE effect size estimates for a change in PD15adj for each cohort (square) as well as a weighted estimate of the meta-analysis (diamond). The shaded represents the interquartile range and the whiskers represent the 95% confidence interval

