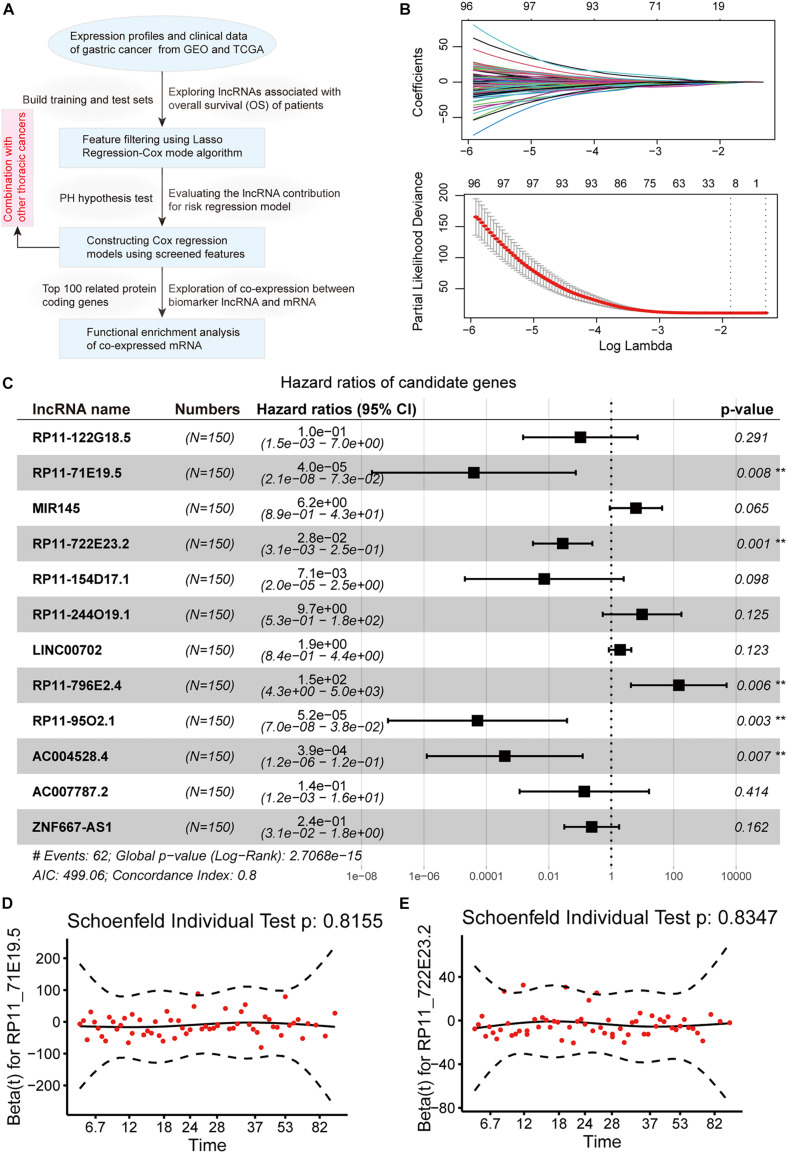
FIGURE 1.
Identification of lncRNAs associating with gastric cancer prognosis. (A) The workflow of our analysis pipeline. (B) Lasso regression model screened characteristic lncRNAs. Variation curve of regression coefficient and β value. (C) Forest plot of multivariate Cox regression results, which include p-value and confidence interval of hazard ratios. (D,E) The diagram shows the results of the PH hypothesis test. The horizontal axis represents the survival time, and the vertical axis represents the Schoenfeld residual.

