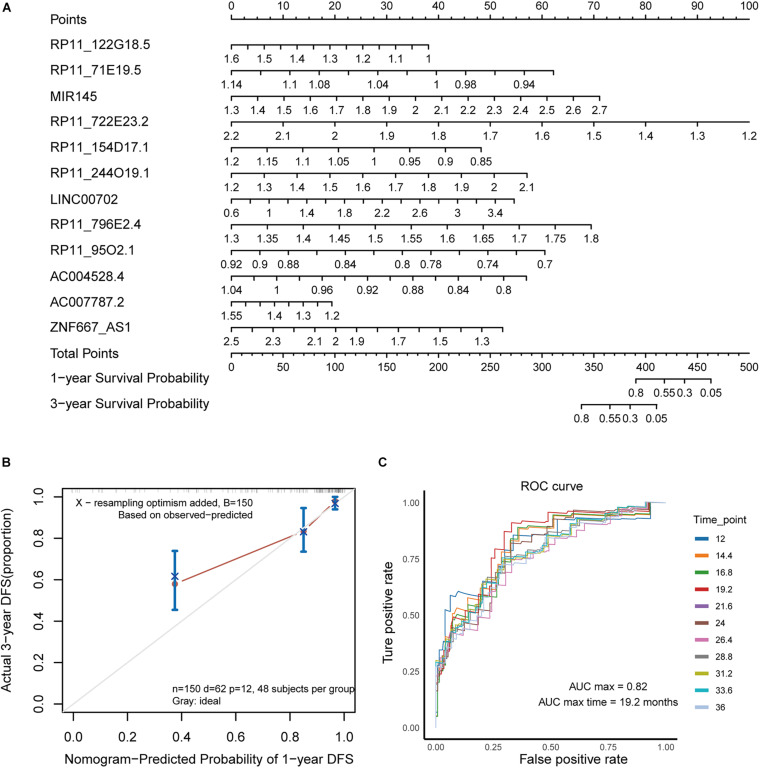
FIGURE 2.
Evaluating the lncRNA contribution for risk prediction model. (A) The nomogram shows the prediction model of survival probability. (B) Calibration curve of the nomogram. (C) The ROC curve reflects the performance of the Cox risk regression model in predicting the probability of survival of patients at different time nodes.

