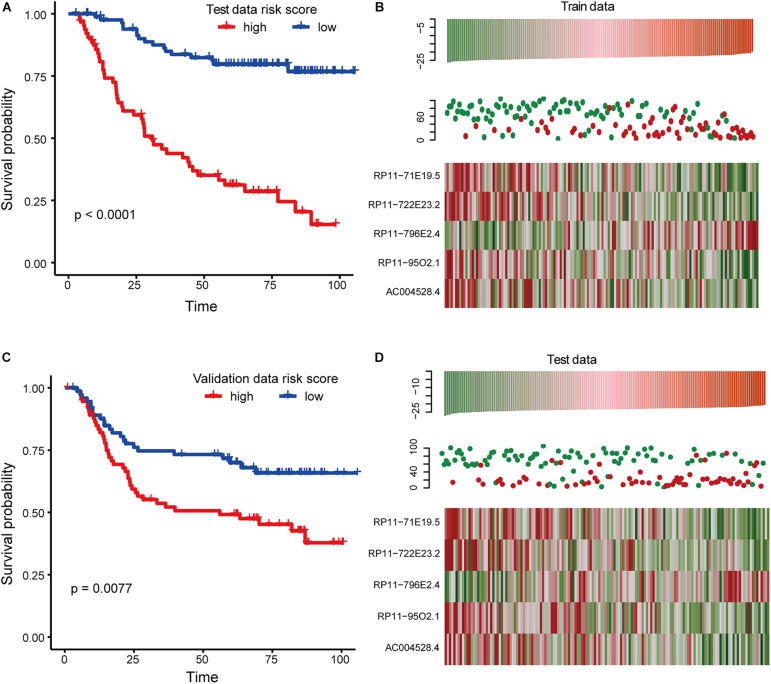
FIGURE 3.
Survival analysis in training and testing dataset. (A) Kaplan-Meier curve reflects the difference of overall survival (OS) between high and low-risk score samples for the training set. (B) This graph reflects the expression levels of biomarkers for the training set as well as the survival status and risk scores of the patients. (C) The same as in (A) but for the test set. (D) The same as in (B) but for the test set.

