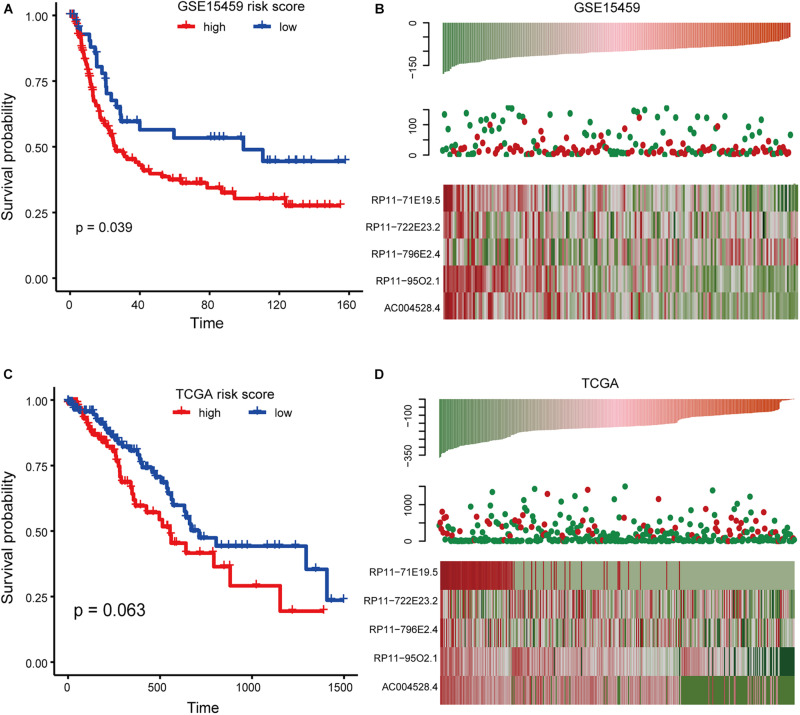
FIGURE 4.
Survival analysis in the GSE15459 and TCGA dataset. (A) Kaplan-Meier curve of risk score model based on GSE15459 data. (B) Expression pattern of lncRNA and survival status and risk score of patients based onGSE15459 data. (C) The same as in (A) but for the RNA-seq profile from TCGA. (D) The same as in (B) but for the RNA-seq profile from TCGA.

