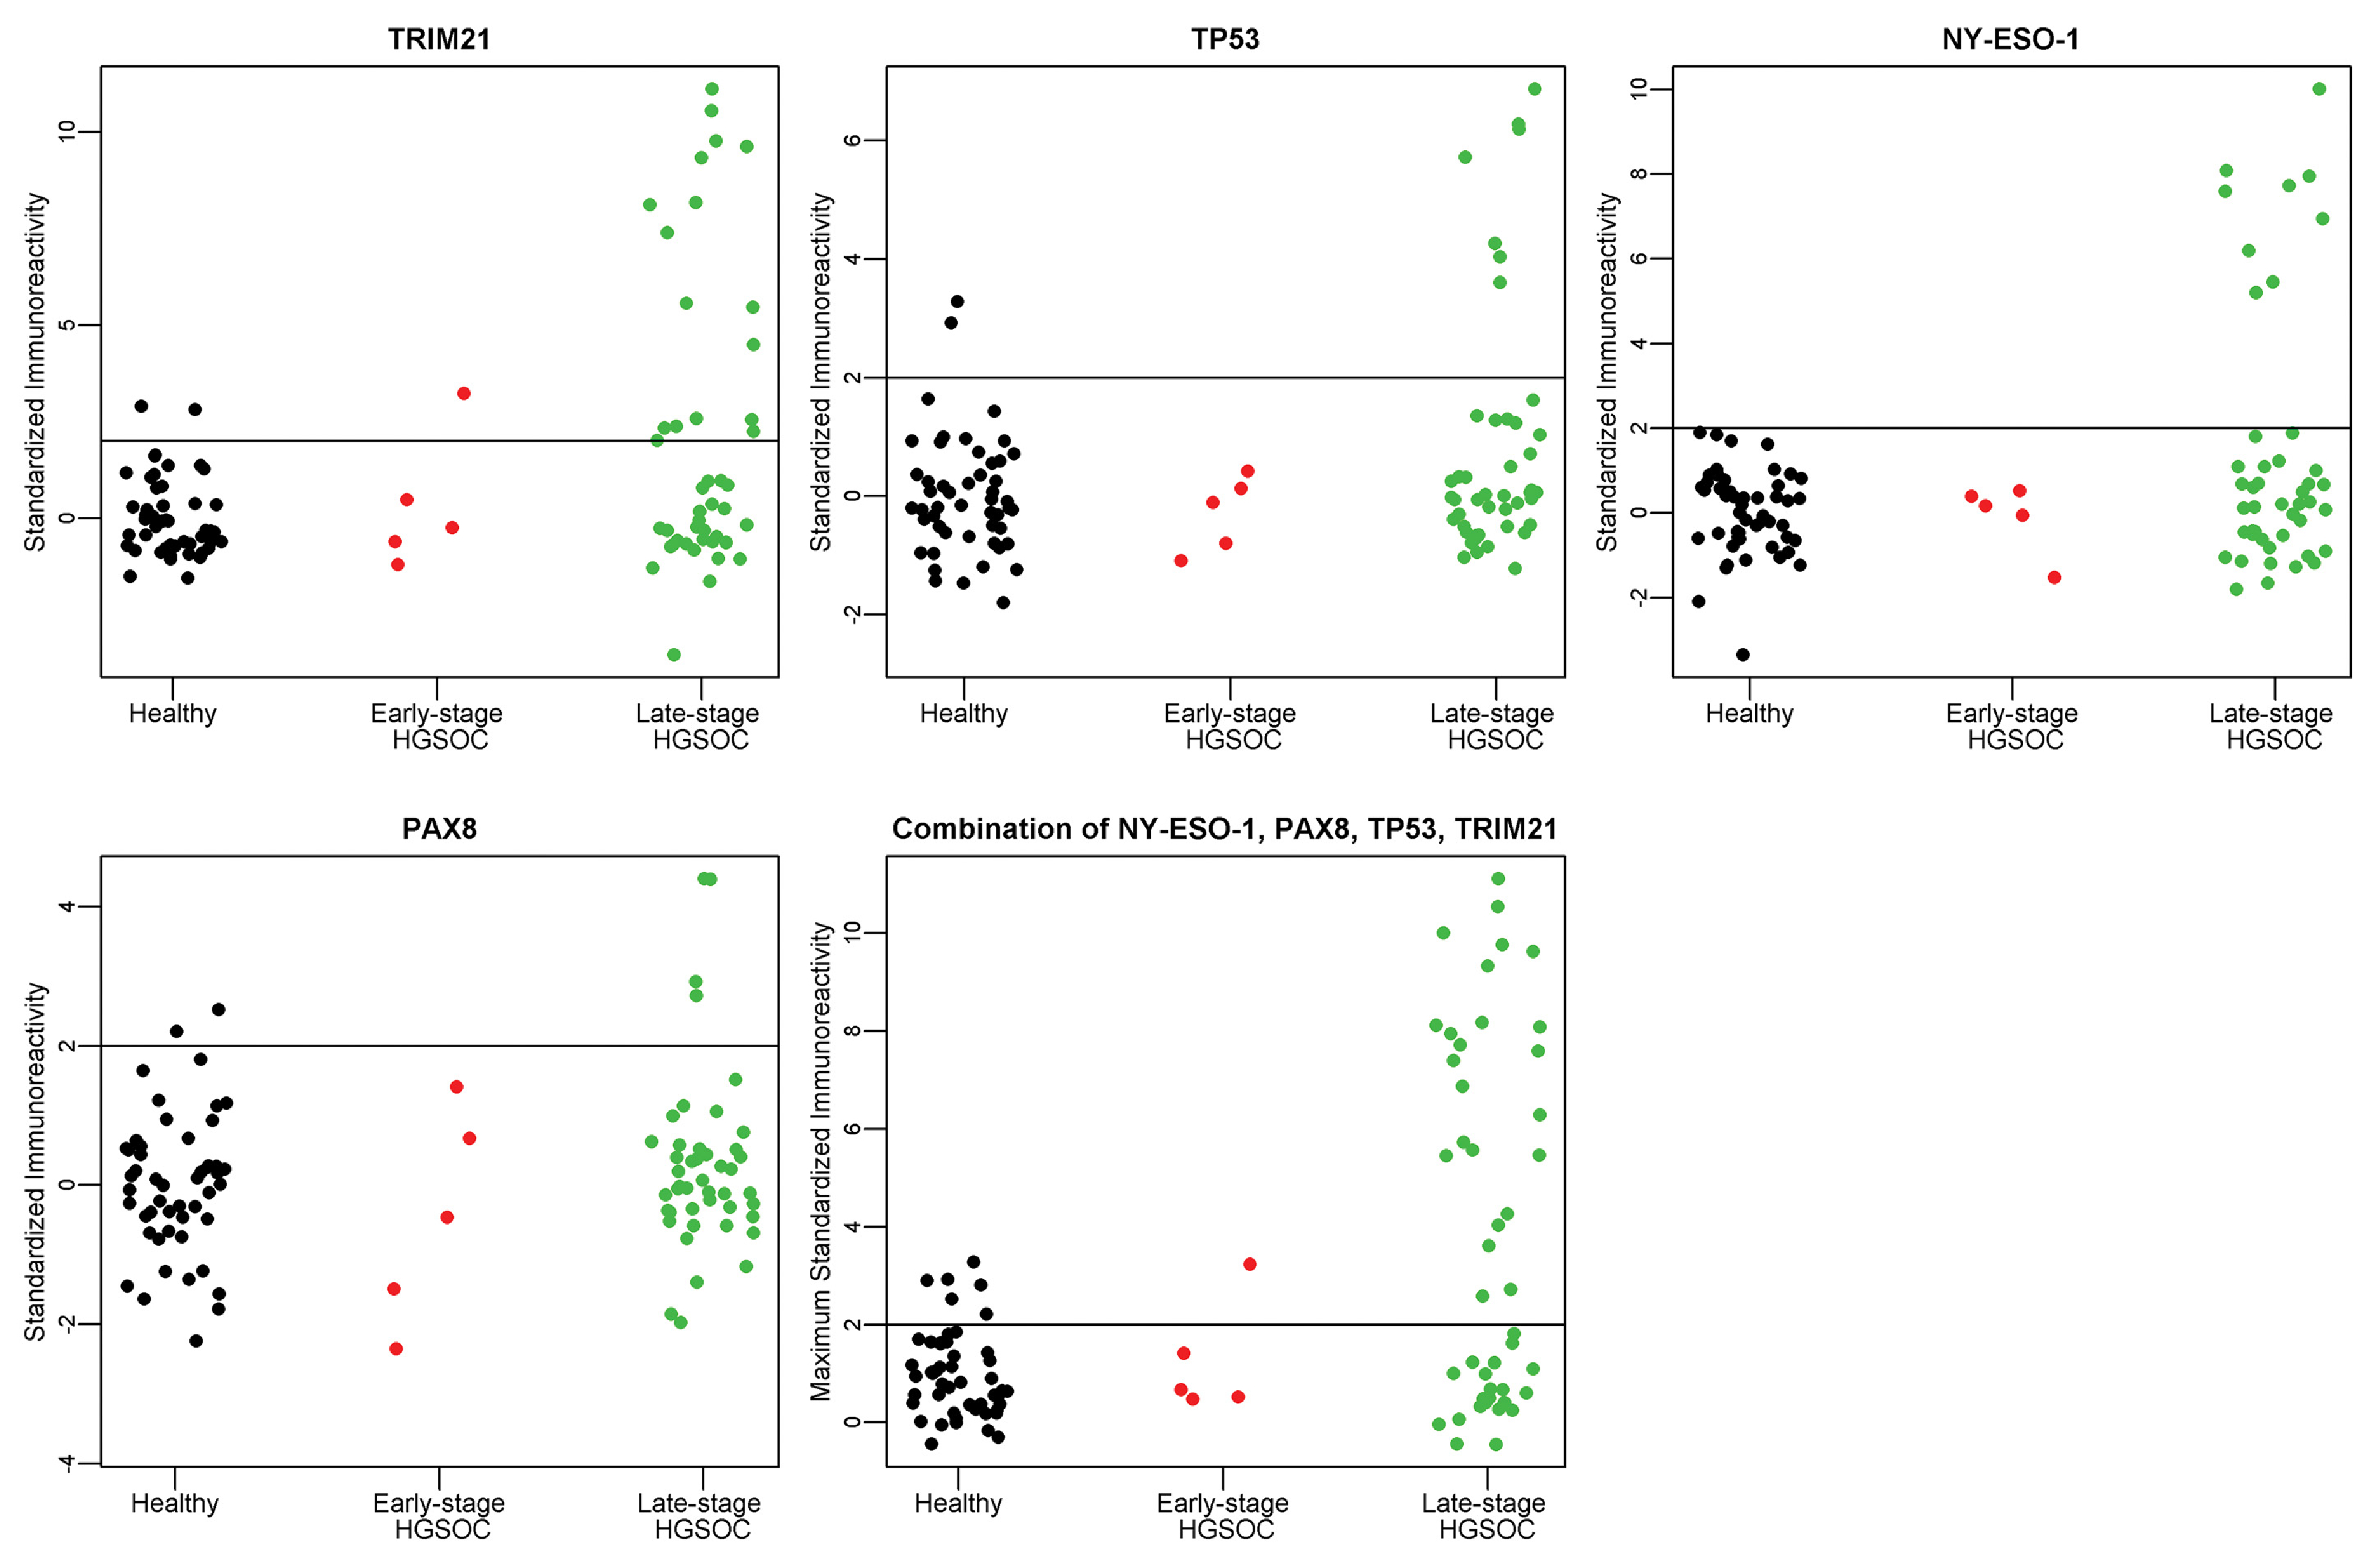
Fig. 4.

A–D. Individual antigen plots for 4 antigens, TRIM21, NY-ESO-1, TP53, and PAX8 in Validation II. E. Maximum value of TRIM21, NY-ESO-1, TP53, or PAX8 in Validation II. The immunoreactivity as defined by the ratio of 800/700 is standardized for each antigen to provide the threshold of Mean + 2 (StdDev) for healthy controls, as indicated by the horizontal line at Y = 2.
