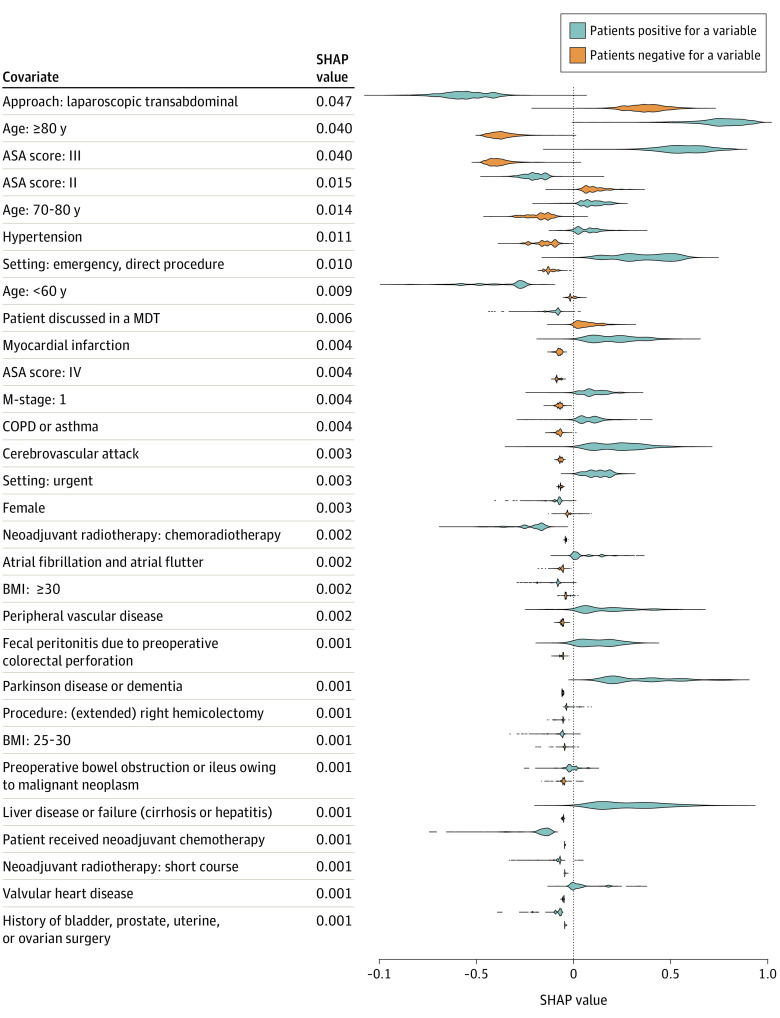
Figure 4. Variables That Demonstrated the Greatest Association With Prediction of 30-Day Mortality.
Top 30 Shapley additive explanation (SHAP) feature values of the gradient-boosting model for prediction of 30-day mortality. SHAP values were calculated per variable for all patients in the test set. Distributions of SHAP values for patients are shown in blue (patients who are positive for a variable) and orange (patients who are negative for a variable). SHAP values were ranked by the mean of the absolute value across all patients in the test set. ASA indicates American Society of Anesthesiology; BMI, body mass index (calculated as weight in kilograms divided by height in meters squared); COPD, chronic obstructive pulmonary disease; and MDT, multidisciplinary team.

