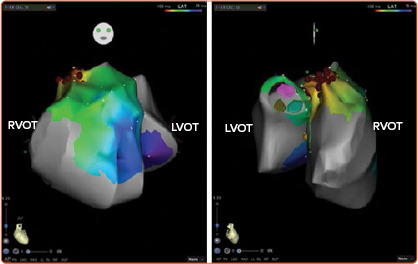
Figure 1: Activation Map of Ventricular Arrhythmias Originating from the Posteroseptal Right Ventricular Outflow Tract Site.

Anteroposterior (left) and laterolateral (right) projections showing the 3D relationship between the right and left ventricular outflow tracts (RVOT and LVOT, respectively). Red dots, surrounding the area of earliest activation, represent ablation sites, and the left and right coronary cusps are shown in pink and green, respectively. The main body of the RVOT wraps itself around the LVOT and then becomes situated anterior and to the left of the aortic valve. LVOT = left ventricular outflow tract; RVOT = right ventricular outflow tract.
