
. 2021 Apr 12;23(4):e19875. doi: 10.2196/19875
©André Mamede, Gera Noordzij, Joran Jongerling, Merlijn Snijders, Astrid Schop-Etman, Semiha Denktas. Originally published in the Journal of Medical Internet Research (http://www.jmir.org), 12.04.2021.
This is an open-access article distributed under the terms of the Creative Commons Attribution License (https://creativecommons.org/licenses/by/4.0/), which permits unrestricted use, distribution, and reproduction in any medium, provided the original work, first published in the Journal of Medical Internet Research, is properly cited. The complete bibliographic information, a link to the original publication on http://www.jmir.org/, as well as this copyright and license information must be included.
Figure 4.
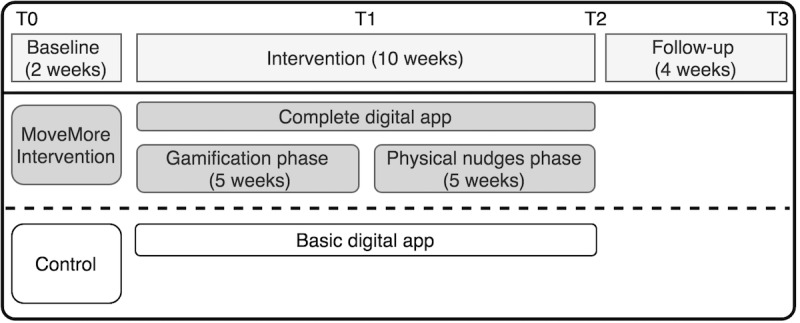
Illustration of study and intervention design. T0 to T3 represent the measuring moments.