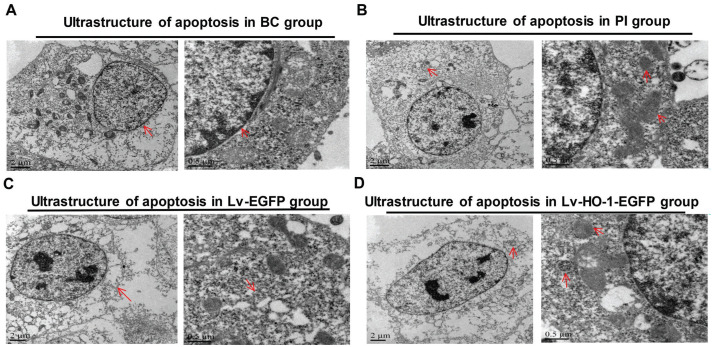
Figure 4. Differences in the ultrastructure of ARPE-19 cells by TEM.
A: In BC group, the red arrows show that cells were slightly damaged and the nuclei were intact; B: In PI group, the red arrows display that residual mitochondria and autophagosome-like structures were observed in the cytoplasm; C: In Lv-EGFP group, the red arrows indicate cell damage was severe with disappeared organelles; D: In Lv-HO-1-EGFP group, cell damage was obvious with a small amount of autophagic vacuoles.

