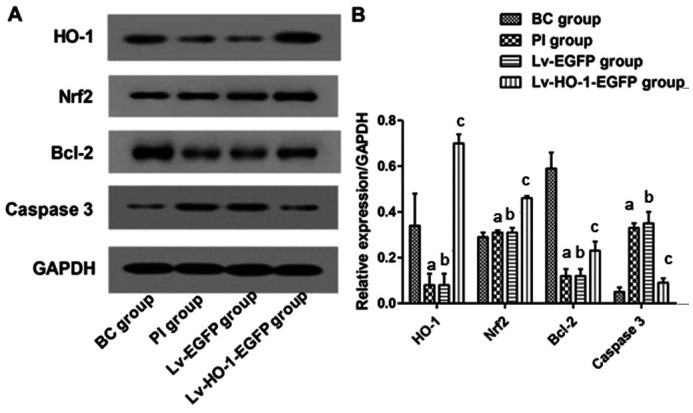
Figure 5. Expressions of HO-1, Nrf2, Bcl-2, and caspase-3 in each group.
A: Images for bands of the immunoblotting; B: Relative expressions of HO-1, Nrf2, Bcl-2, caspase-3 proteins to GAPDH. aCompared with blank control group, P<0.01; bCompared with simple injury group, P>0.05; cCompared with empty-body RPE group, P<0.01.

