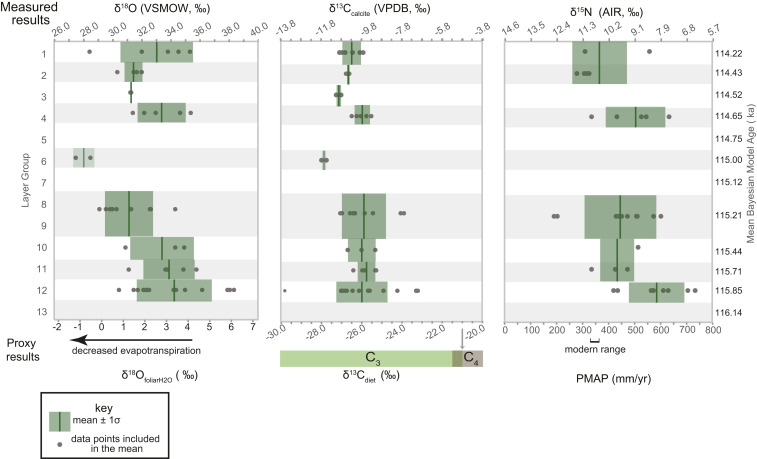
Fig. 4.
Oxygen, carbon, and nitrogen isotope data for OES from YFT1. Horizontal axes show measured values (Upper) and corresponding proxy values (Lower). Vertical axes show stratigraphic LGs (Left) and mean Bayesian model ages (Right). Mean values (green blocks) are calculated for samples from each LG, showing environmental variability during human occupancy of YFT1. LG 6 is constrained by only two data points, and there is no data for directly bracketing layers and thus should be interpreted with caution. Note that δ15N and δ18O values vary inversely, while δ13C values remain roughly constant throughout the occupation of YFT1, suggesting that decreasing evapotranspiration through time was driven by falling temperature.

