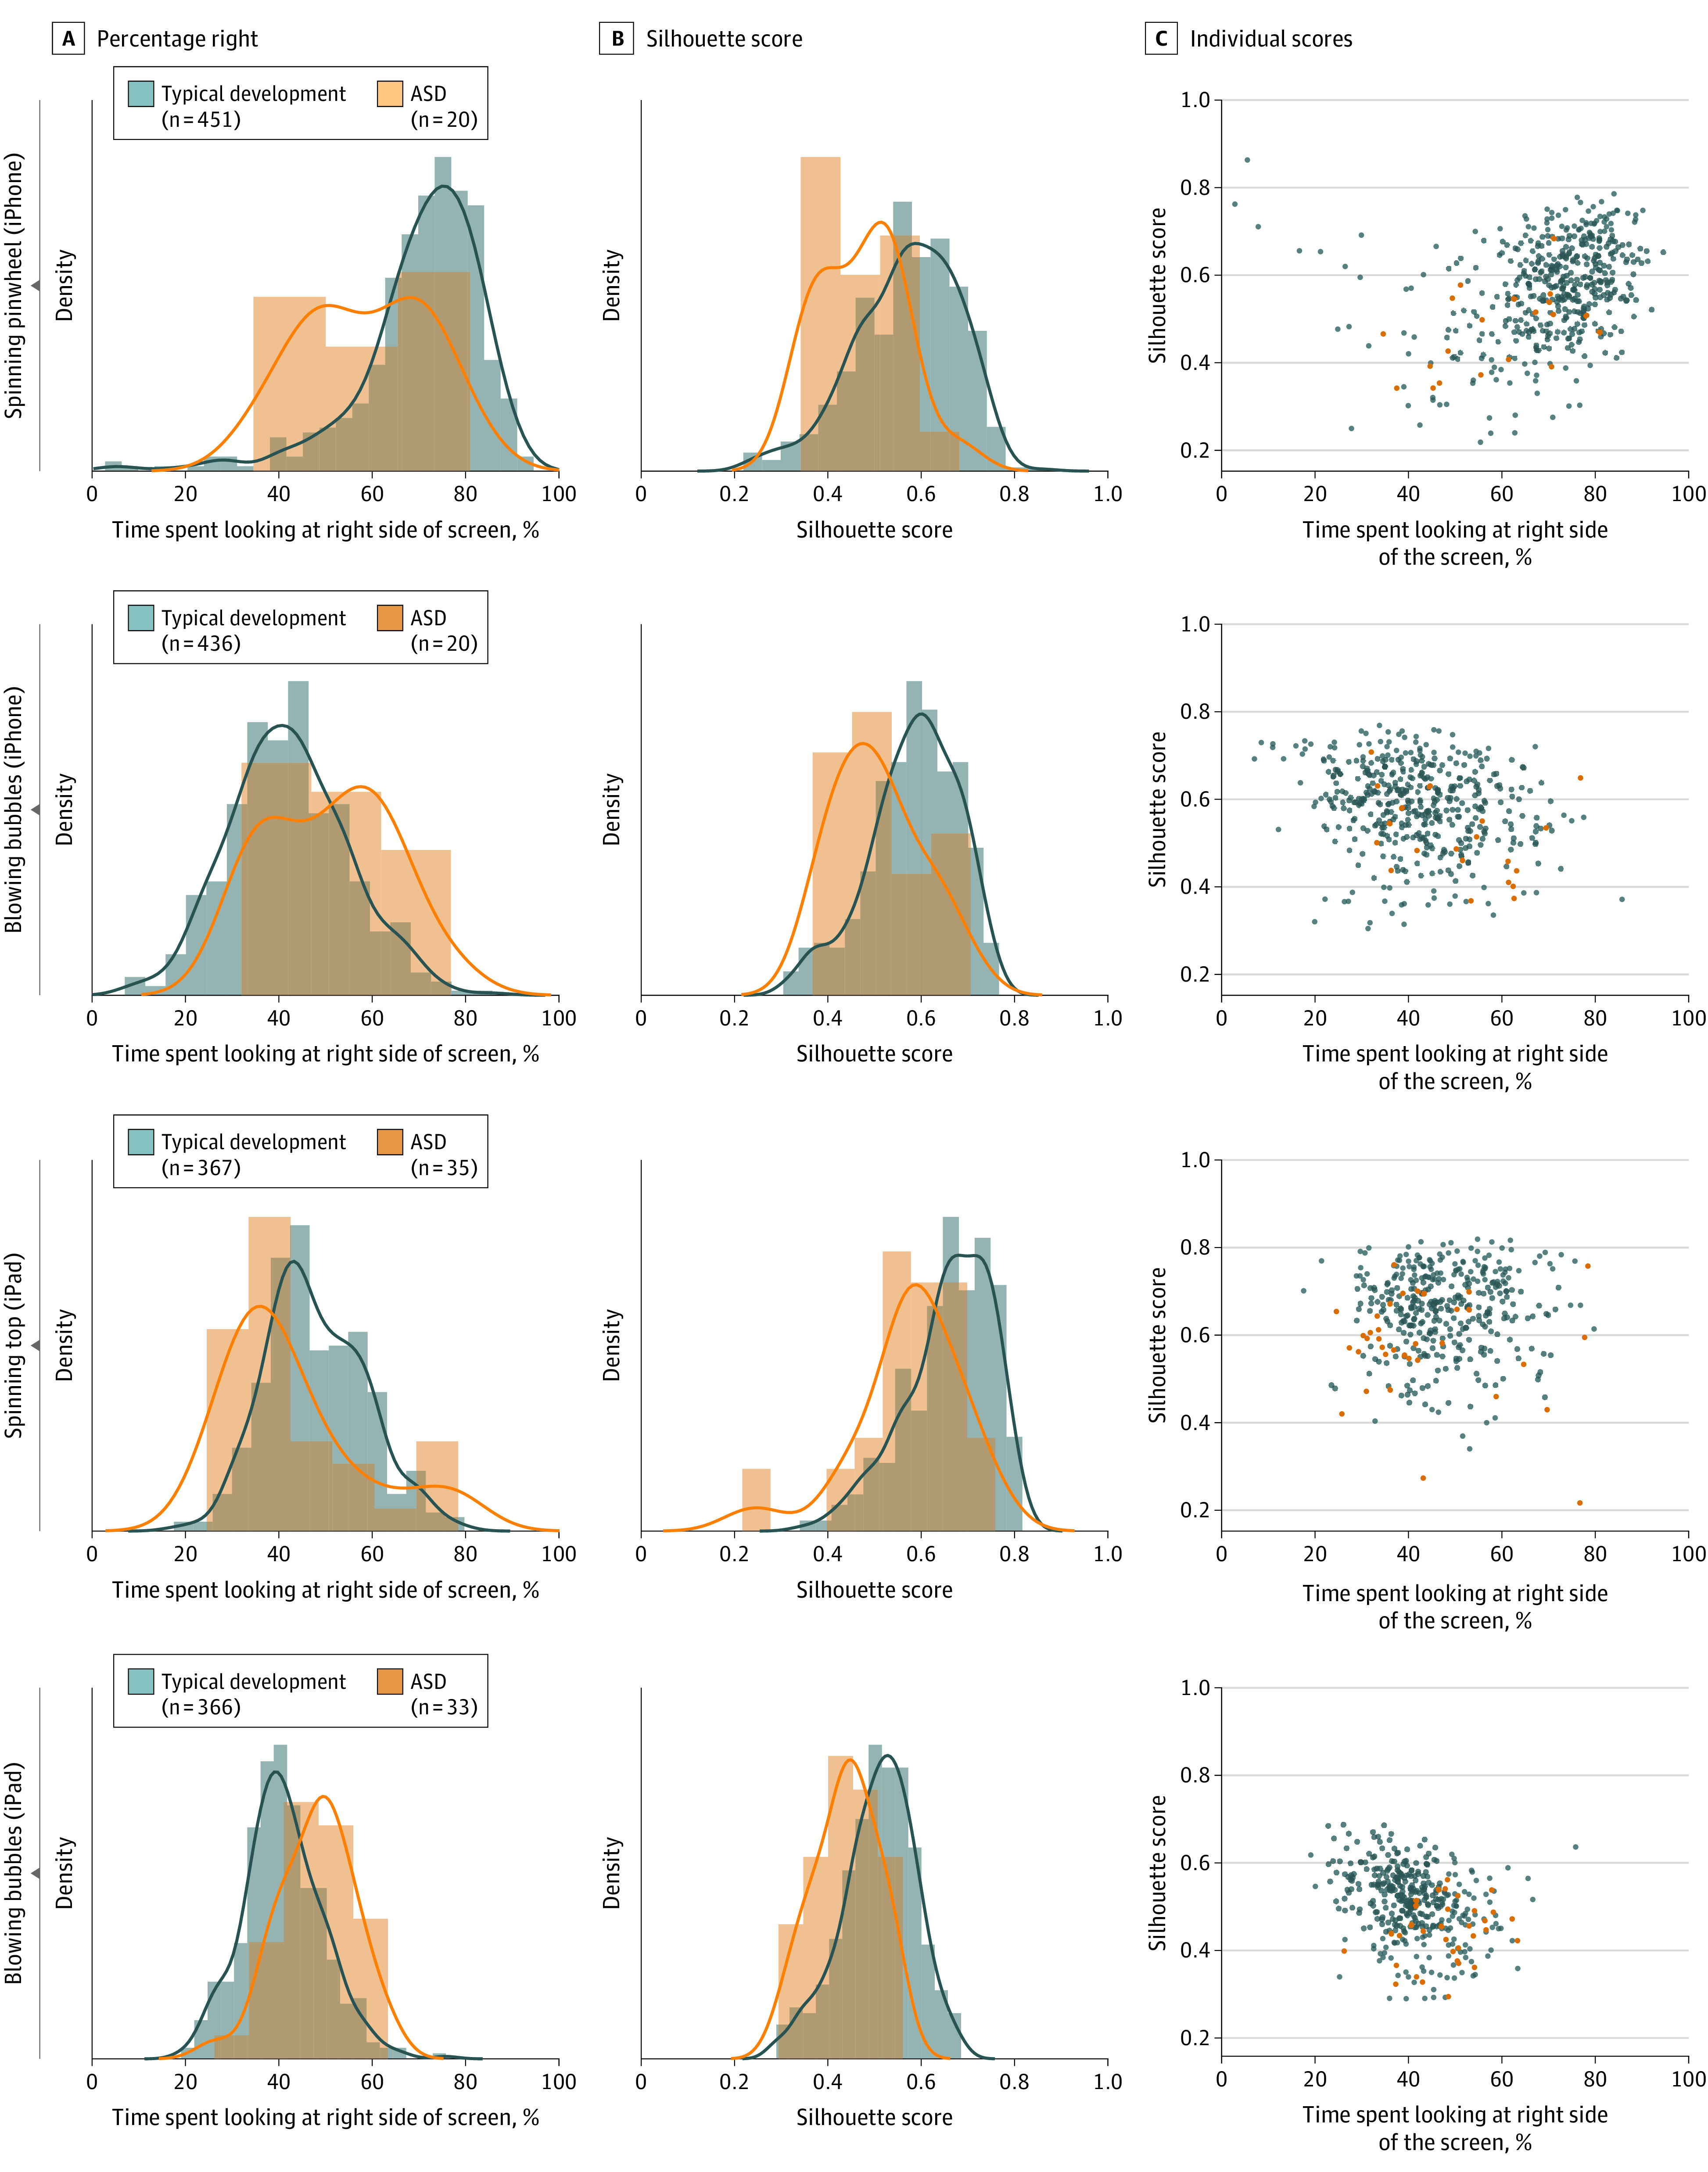
Figure 1. Social vs Nonsocial Gaze Preference.

Gaze data for 4 movies that depicted a person on one side of the screen playing with toys located on the opposite side of the screen. A, Distribution of percentage right scores (percentage of time spent looking at the right side of the screen) for each movie. B, Distribution of silhouette scores for each movie. C, Scatterplots displaying individual participant percentage right (horizontal axis) and silhouette scores (vertical axis). For “spinning pinwheel” (iPhone), the person is on the right side of the screen; for “blowing bubbles” (iPhone), the person is on the left side; for “spinning top” (iPad), the person is on the right side; and for “blowing bubbles” (iPad), the person is on the left side. ASD indicates autism spectrum disorder.
