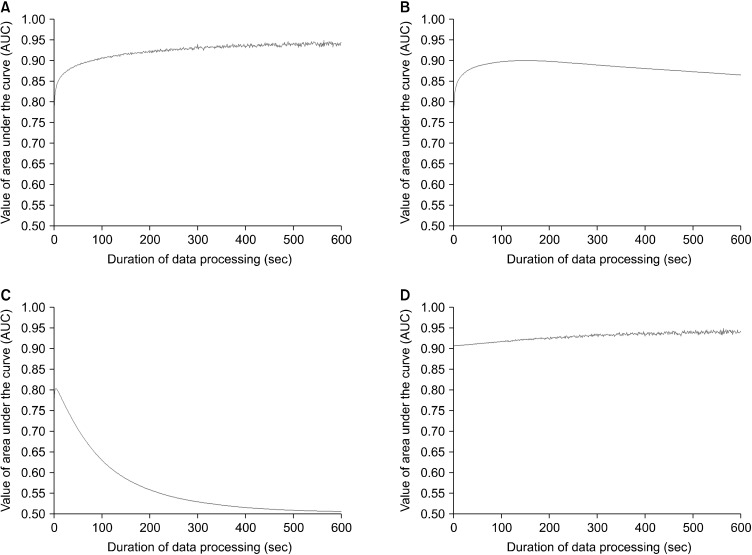
Fig. 3.
Comparison of the prediction power on sleep-wake state by four methods of data processing. Data summation (A), moving average (B), tolerance (C) and data summation after moving average with a 120 second leading (D). (A) Data summation shows an initial increase, a plateau after 100 seconds and flatness around 0.91 after 300 seconds. (B) Moving average initially presents a similar pattern like data summation. There is a maximal value around 120 seconds and a slight decrease around to 0.86 after 200 seconds. (C) Permission indicates an initial increase up to 0.8 around 10 seconds and then gradual descent to around 0.5. (D) Combination method means to use the data summation after moving average with 120 second leading. Combination method shows a slight increase of the area under the curve (AUC) value up to 0.94.

