FIGURE 2.

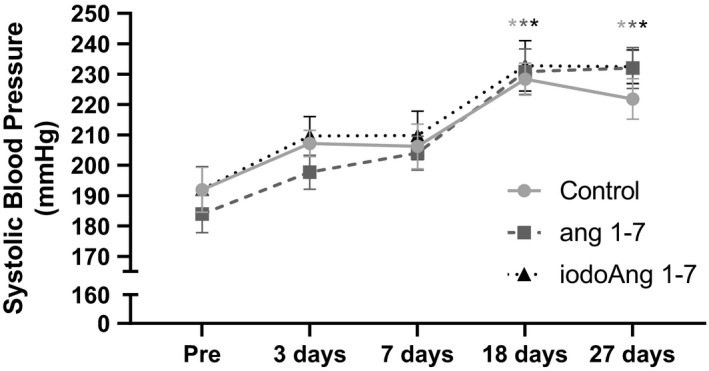
Systolic blood pressure in all studied groups at pre, 3, 7, 18, and 27 days of the protocol. Each * indicates p < 0.05 compared to day zero for all 3 groups.

Systolic blood pressure in all studied groups at pre, 3, 7, 18, and 27 days of the protocol. Each * indicates p < 0.05 compared to day zero for all 3 groups.