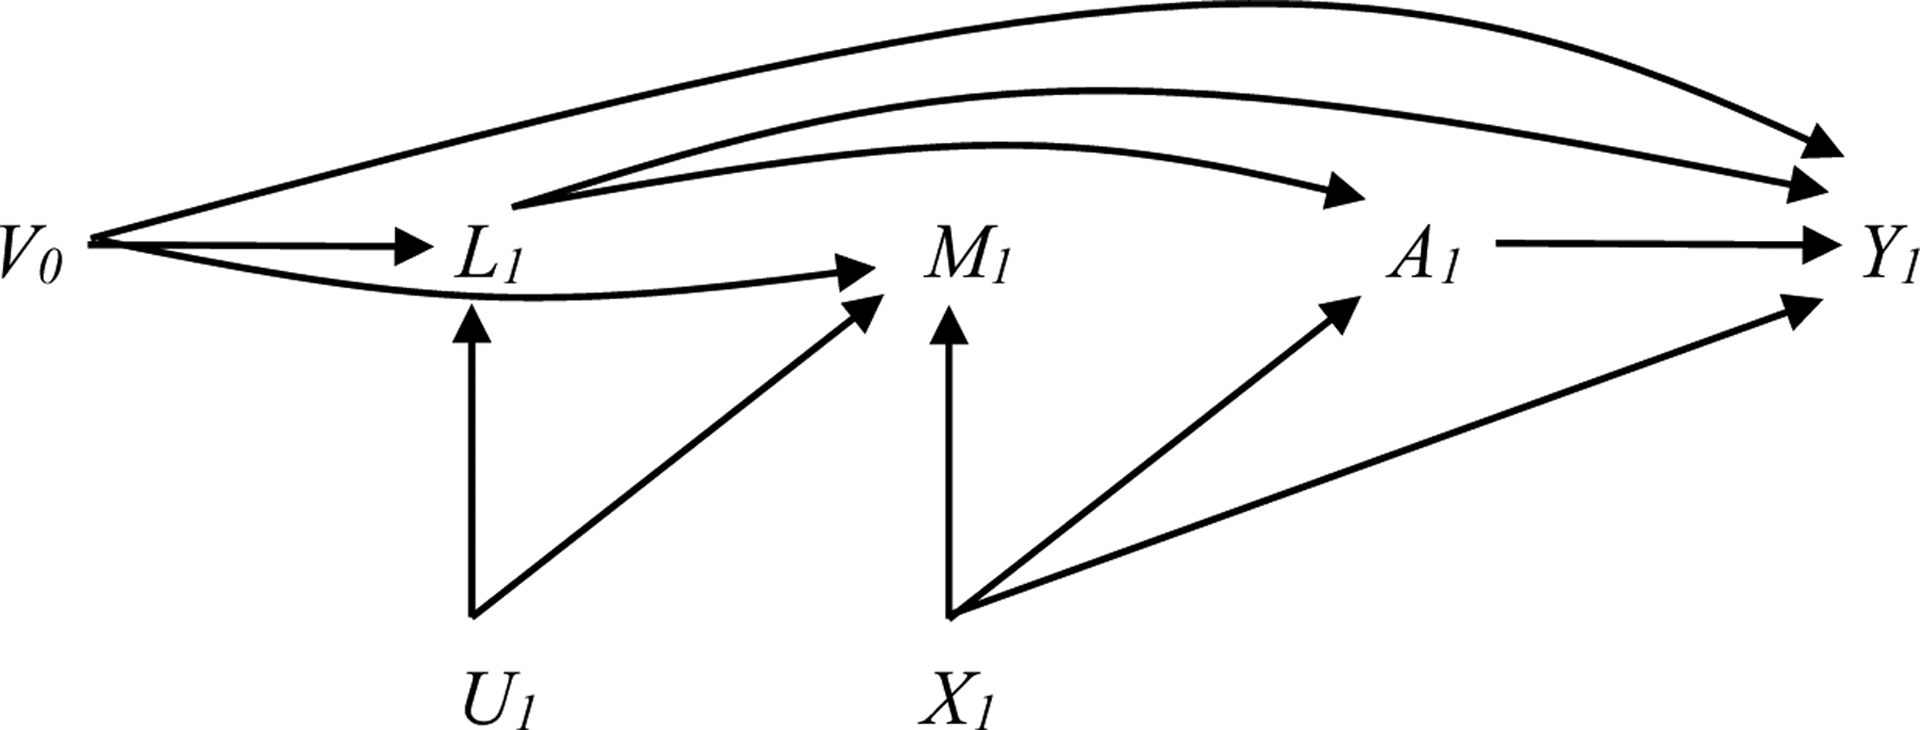
Figure 1c. Causal DAG for estimating the effect of reducing AUDIT score to <8 (A) on co-occurring conditions (Y) under various assumptions about the causal structure of the data (shown at one time point only).

assumes the following temporal ordering of variables: L1, M1, A1. L1, M1, and V0 are included in the weight model.
V0 includes: baseline covariates (HIV status, race, education, income); past year cannabis, cocaine, other stimulants, and illicit opioids measured at time 0; past year alcohol measured at time 0; and current depression, anxiety, smoking, and pain measured at time 0
L1 past year cannabis, cocaine, other stimulants, and opioids measured at time 1
U1 Potential unmeasured common causes at time 1
A1 past year alcohol measured at time 1
M1 current depression, anxiety, smoking, and pain measured at time 1 (exclude outcome)
X1 Potential common cause(s) of M1 and A1
Y1 outcome measured at time 1 (for depression, anxiety, smoking, and pain as outcome only)
