
FIGURE 3.
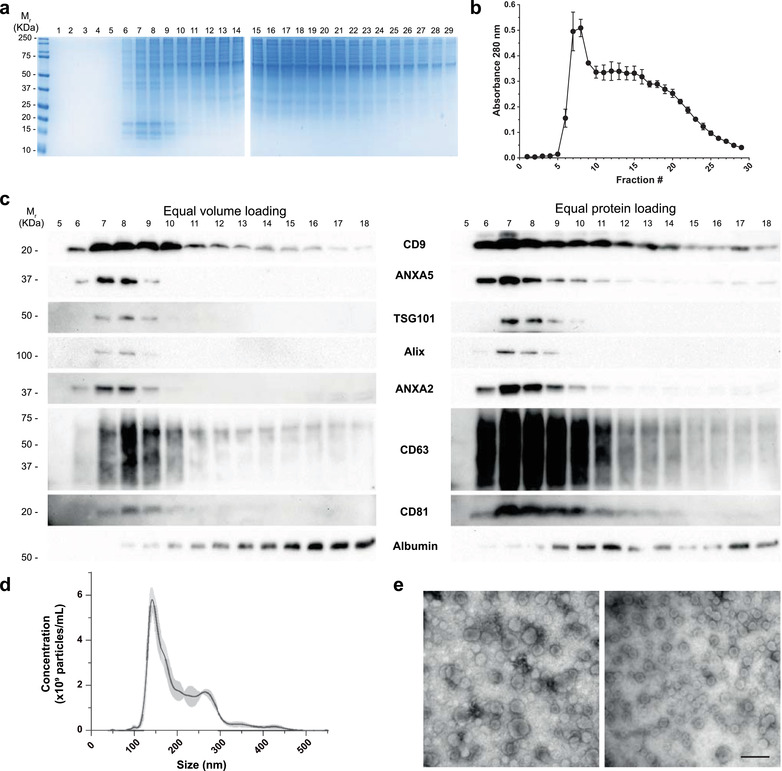
Characterization of MDA‐MB‐468 derived EVs using Pre‐SEC. (a) Coomassie staining showing the protein pattern of 29 fractions collected after Pre‐SEC separation. Notice the enrichment of small molecular weight proteins between fractions 6 to 11. (b) Relative protein content of the 29 fractions collected using Pre‐SEC. The highest values were detected between fractions 6 to 9 (n = 3) (c) Western blots showing the distribution of EV protein markers from fractions 5 to 18. Equal volume (27 μl) or an equal amount of protein (20 μg/lane) was loaded for gel electrophoresis. (d) Nanoparticle tracking analysis of EV samples (n = 3) obtained from fractions 5 to 16 from Pre‐SEC. (e) Transmission electron microscopy of MDA‐MB‐468 derived EVs from fractions 5–16 obtained by Pre‐SEC. Two fields of view are shown to represent the size diversity observed in the sample. Scale bar = 500 nm