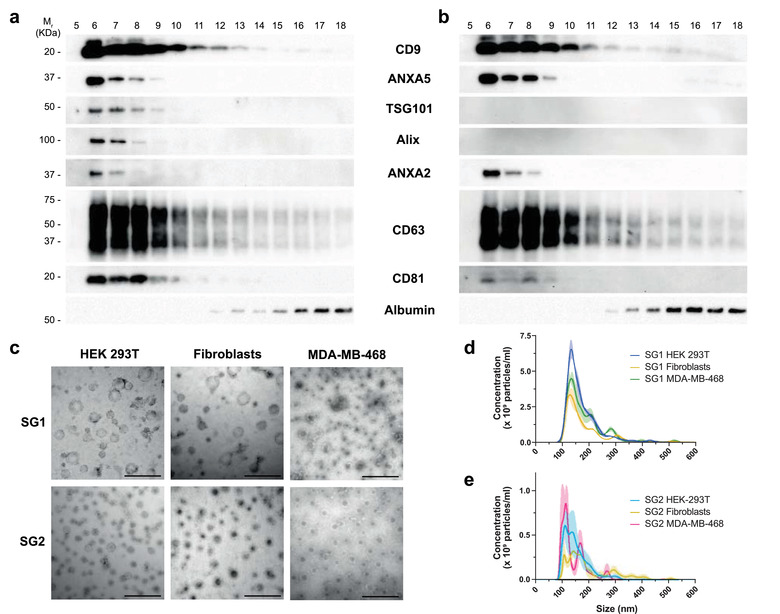
FIGURE 4.

Analysis of EV subgroups obtained by Pre‐SEC of HEK293T, primary fibroblasts, and MBA‐MD‐468 EV samples. Western blot at a constant protein loading (20 μg/lane) showing the distribution of EV markers detected in HEK293T (a) and primary fibroblast (b) EV samples. We divided the fractions in two groups to determine the characteristics of EVs in early‐eluting fractions or subgroup 1 (SG1, fractions 5–10) and late‐eluting fractions or subgroup 2 (SG2, fraction 11–16). (c)Transmission electron microscopy EVs derived from HEK293T cells, primary fibroblasts, and MDA‐MB‐468 cells. We show representative images of each subgroup (n = 3). Scale bar = 500 nm. (d‐e) Nanoparticle tracking analysis (n = 3 for each cell type) of SG1 (d) and SG2 (e) of EVs derived from HEK293T cells, primary fibroblasts, and MDA‐MB‐468 cells
