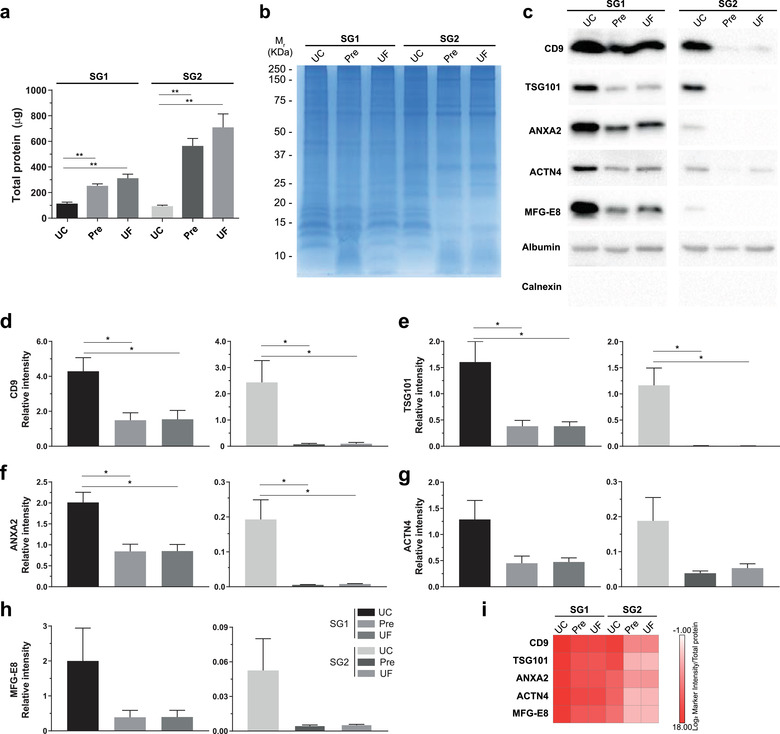
FIGURE 5.

Pre‐SEC yield efficiency after concentration of SG1 and SG2 by different methods. (a) Total protein (μg) obtained from SG1 and SG2 of MDA‐MB‐468‐derived EVs isolated by Pre‐SEC and subsequently concentrated with UC, Pre, or UF. (b) Protein pattern visualized by Coomassie Blue staining from SG1 and SG2 and concentrated by UC, Pre, or UF. (c) Western blot of EV protein markers in samples of SG1 and SG2. (d‐h) Relative quantity (as measured by relative intensity, using Exo‐NM albumin intensity as reference (n = 3)) of EV protein markers CD9 (d), TSG101 (e), ANXA2 (f), ACTN 4 (g), and MFG‐E8 (h) from SG1 and SG2, concentrated by either UC, Pre, or UF. (i) EV abundance calculated as EV marker intensity/total protein ratio
